Open Access
Fig. 8
Download original image
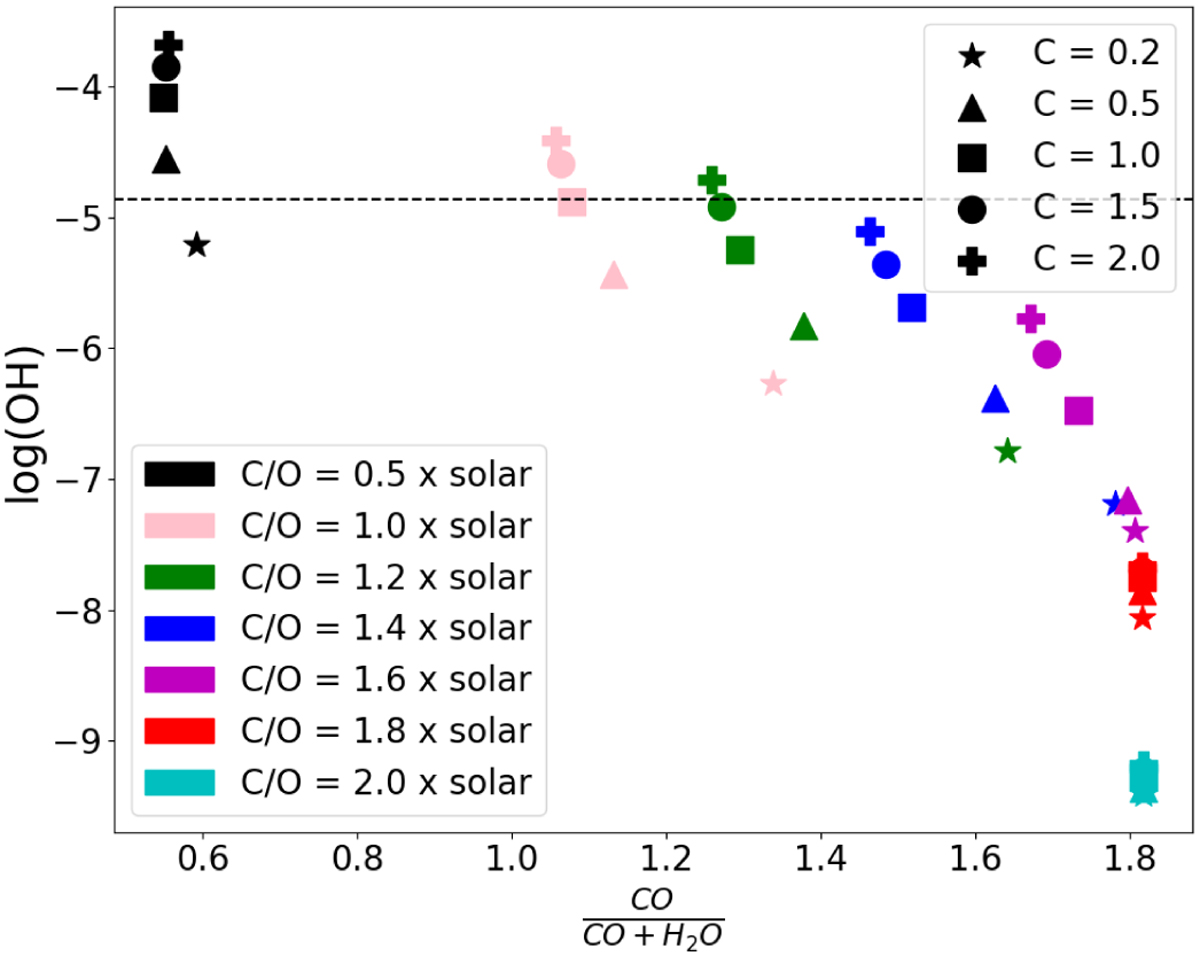
Mean abundances in VMR of OH (averaged over pressures from 100 to 10−4 bar) as a function of the corresponding C/O ratio as estimated using Eq. (5). The black dashed line corresponds to the upper limit abundance found by the data simulator of log(OH)MMR= −4.
Current usage metrics show cumulative count of Article Views (full-text article views including HTML views, PDF and ePub downloads, according to the available data) and Abstracts Views on Vision4Press platform.
Data correspond to usage on the plateform after 2015. The current usage metrics is available 48-96 hours after online publication and is updated daily on week days.
Initial download of the metrics may take a while.