Open Access
Fig. D.1
Download original image
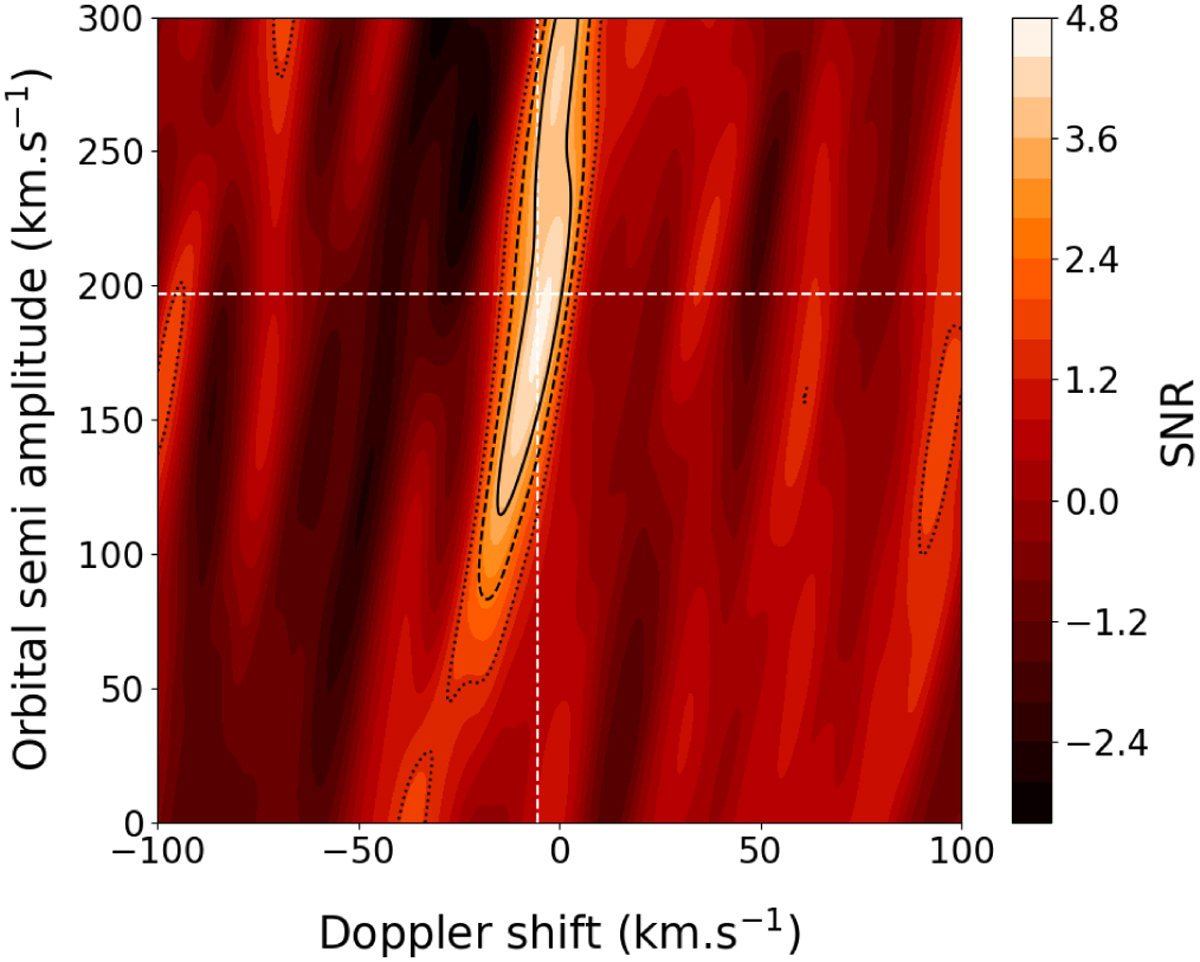
Map resulting from cross-correlation between reduced data of WASP-76 b from the first half of the transit and spectra from a model containing H2O opacity lines (log(H2O)MMR = −5.0), with T = 1500 K. The S/N varies from −3.16 to 4.65, with the maximum S/N of 4.65 obtained for Kp = 184 km s−1 and V0 = −4.5 km s−1.
Current usage metrics show cumulative count of Article Views (full-text article views including HTML views, PDF and ePub downloads, according to the available data) and Abstracts Views on Vision4Press platform.
Data correspond to usage on the plateform after 2015. The current usage metrics is available 48-96 hours after online publication and is updated daily on week days.
Initial download of the metrics may take a while.