Fig. B.1
Download original image
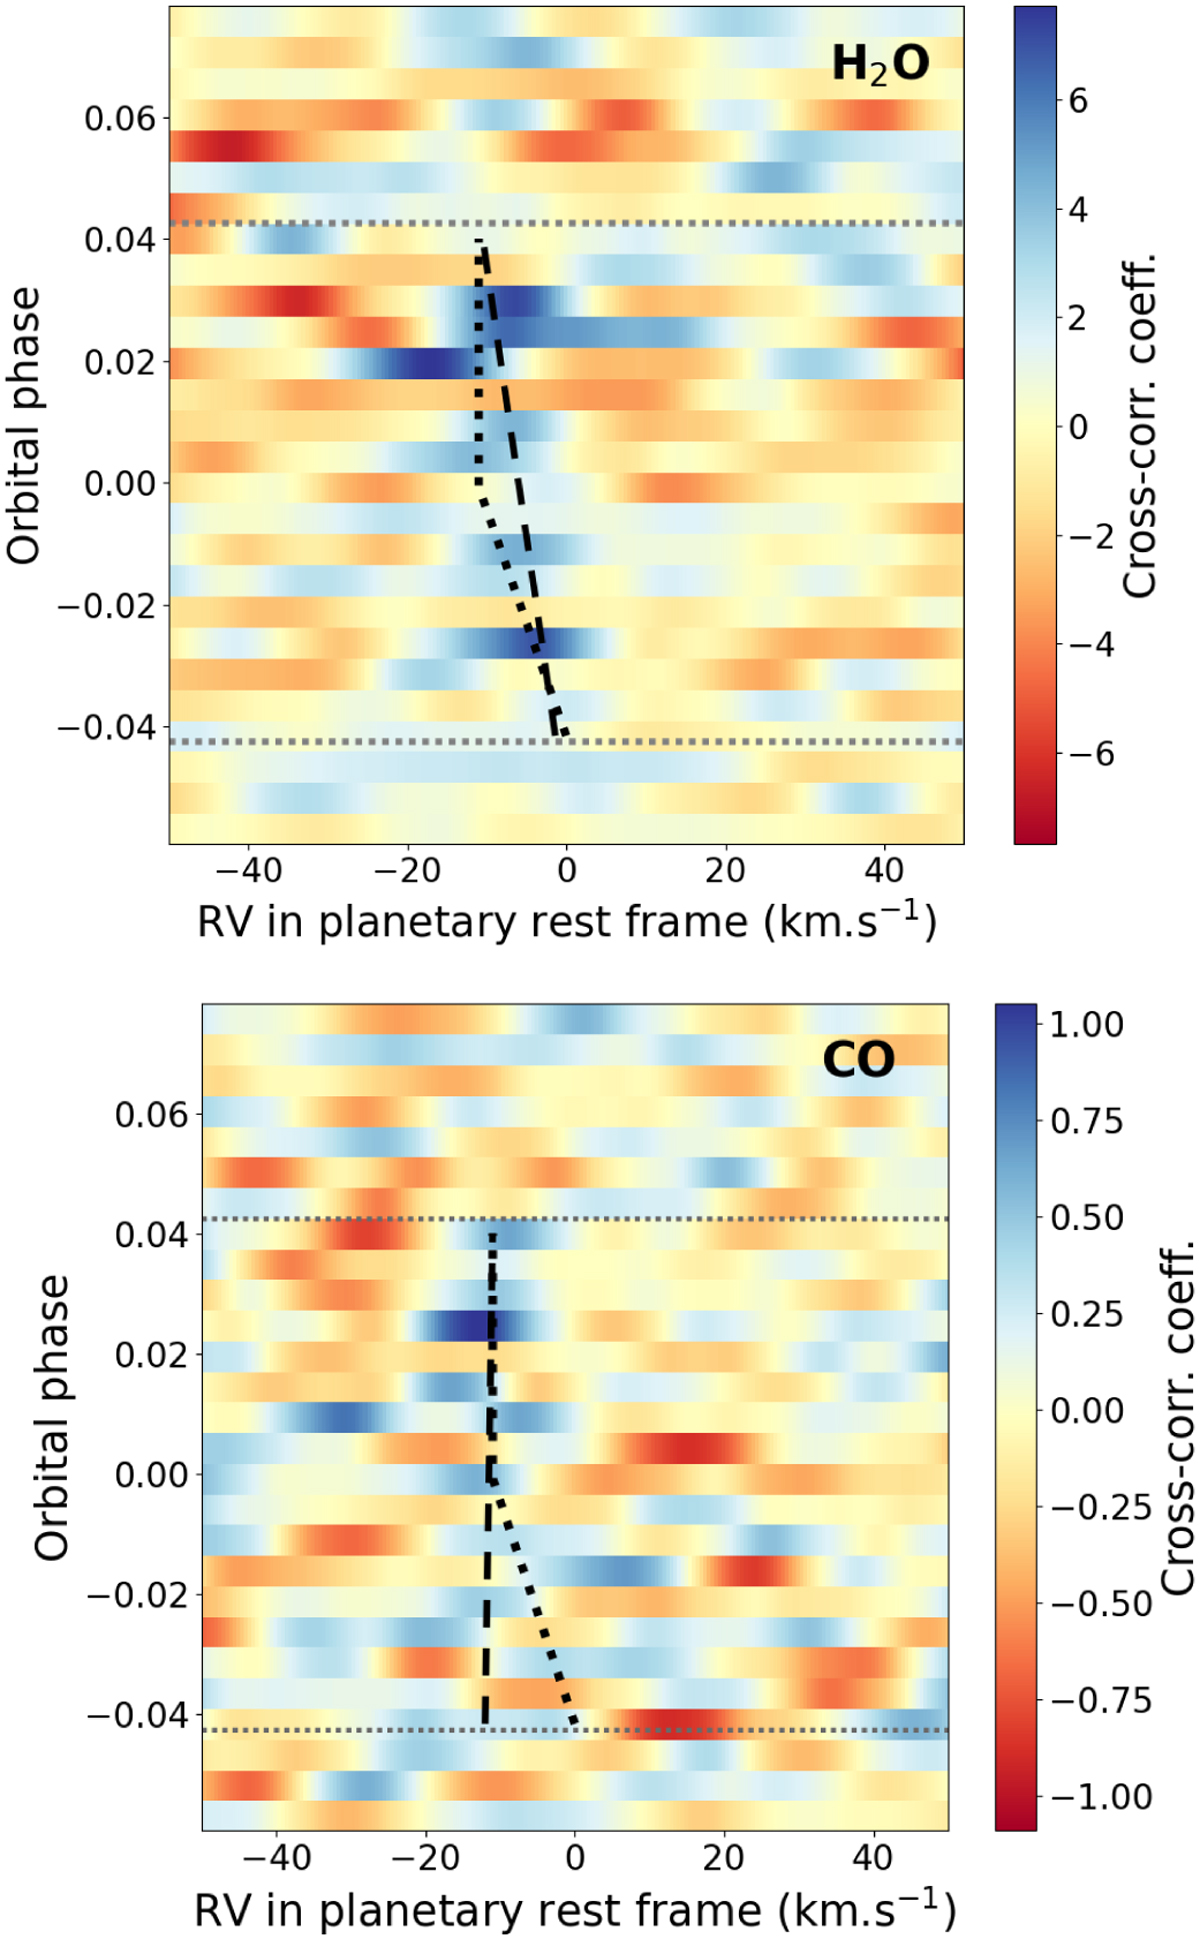
Cross-correlation trails for H2O (top) and CO (bottom). The dashed lines correspond to the absorption trails indicated for each species by the Kp and V0 values reported in Section 4.1. The black dotted lines correspond to the ’kinked’ absorption trail reported for Fe. The grey dotted horizontal lines correspond to the beginning and end of the transit.
Current usage metrics show cumulative count of Article Views (full-text article views including HTML views, PDF and ePub downloads, according to the available data) and Abstracts Views on Vision4Press platform.
Data correspond to usage on the plateform after 2015. The current usage metrics is available 48-96 hours after online publication and is updated daily on week days.
Initial download of the metrics may take a while.