Fig. 10

Download original image
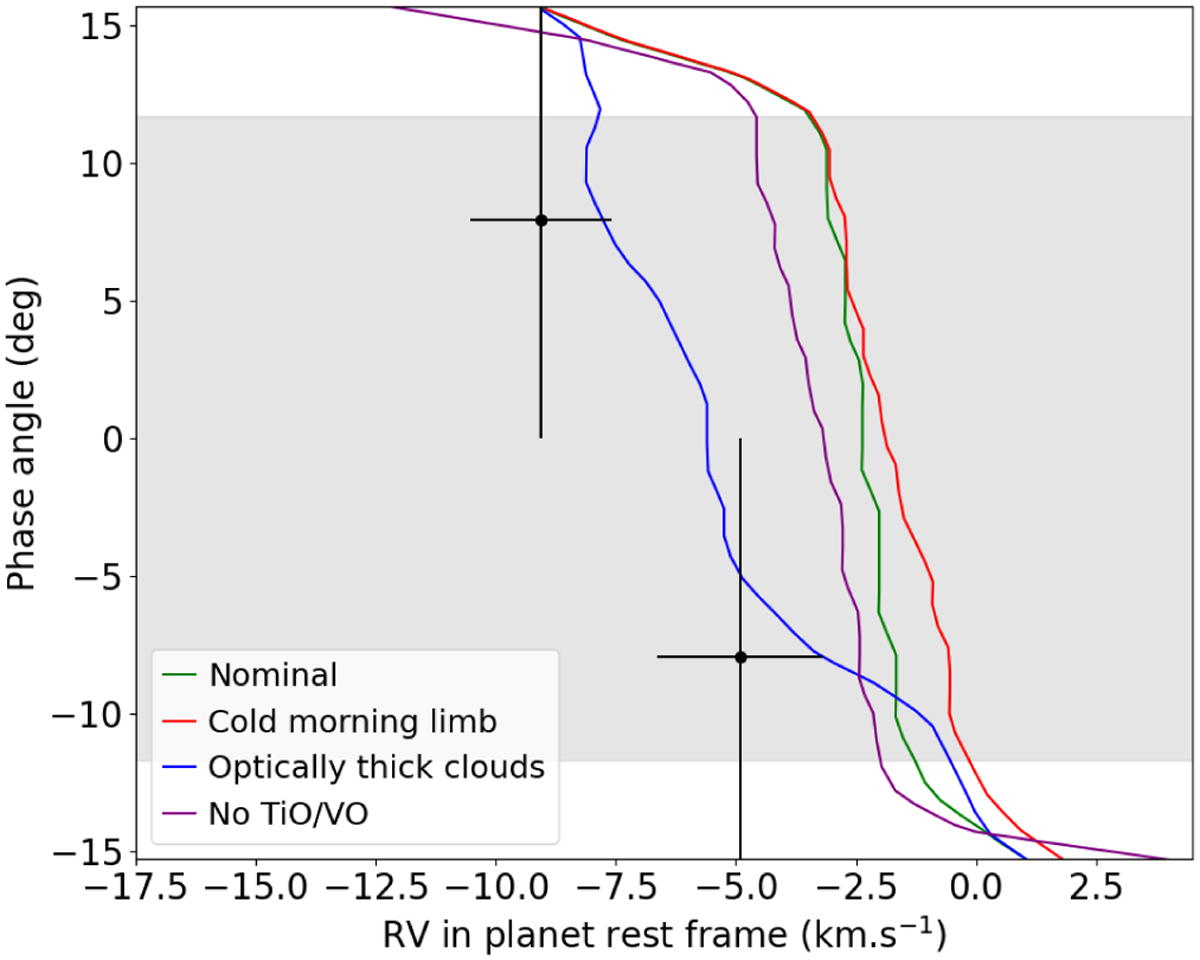
Comparison between cross-correlation profiles for different scenarios for H2O obtained in Wardenier et al. (2023) and radial velocities we obtained for H2O from the mean cross-correlation functions for each half of transit. The ‘nominal’ profile (green) was obtained for a weak-drag model, the ‘cold morning limb’ profile (red) for a model for which the temperature was reduced on the leading limb, the ‘optically thick clouds’ profile (blue) for adding clouds as in Savel et al. (2022), and the ‘no TiO/VO’ profile (purple) for removing TiO and VO from the GCM calculations, considering them cold-trapped. The black dots correspond to the radial velocities obtained from Gaussian fits to the mean cross-correlation functions for each half of transit, the horizontal black bars corresponding to the associated errors, and the vertical black bars indicate the associated phase range. The grey band indicates the transit duration from post-ingress to pre-egress.
Current usage metrics show cumulative count of Article Views (full-text article views including HTML views, PDF and ePub downloads, according to the available data) and Abstracts Views on Vision4Press platform.
Data correspond to usage on the plateform after 2015. The current usage metrics is available 48-96 hours after online publication and is updated daily on week days.
Initial download of the metrics may take a while.


