Fig. 1
Download original image
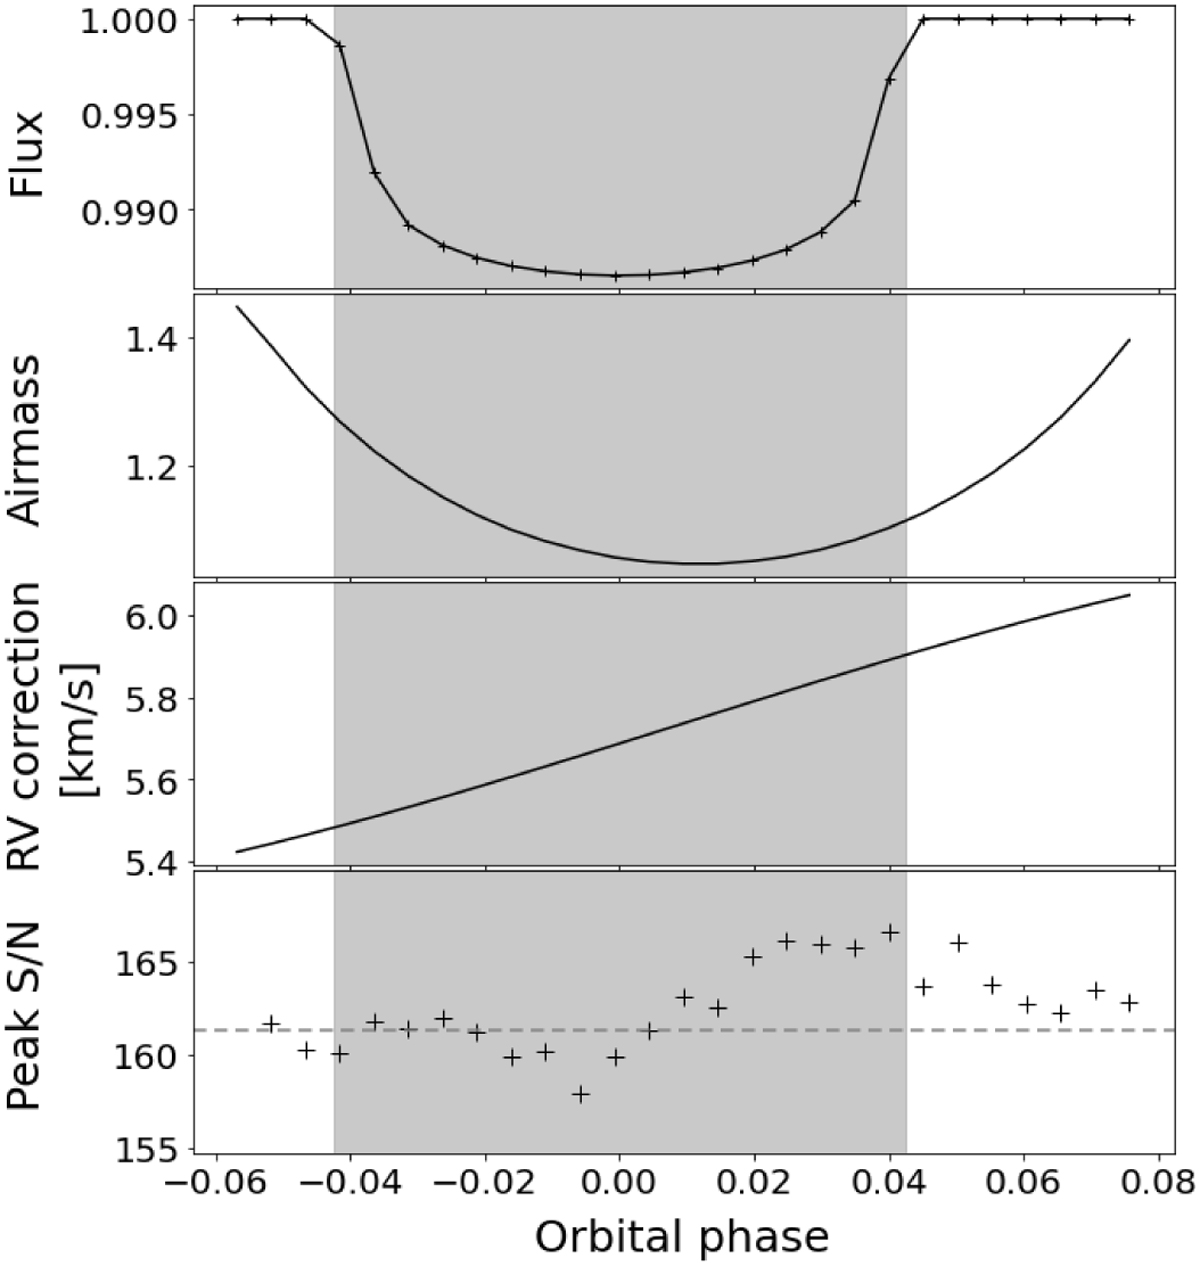
Continuum-normalised light-curve, air mass, radial velocity (RV) correction (containing RV contributions of the barycentric Earth motion and the stellar systemic velocity), and peak S/N per velocity bin over the course of the transit of WASP-76 b as a function of the orbital phase (from top to bottom), computed using the parameters listed in Table 1. The grey band indicates the transit duration of the planet, from first to fourth contact. The horizontal dashed line in the bottom panel represents the average value of the peak S/N.
Current usage metrics show cumulative count of Article Views (full-text article views including HTML views, PDF and ePub downloads, according to the available data) and Abstracts Views on Vision4Press platform.
Data correspond to usage on the plateform after 2015. The current usage metrics is available 48-96 hours after online publication and is updated daily on week days.
Initial download of the metrics may take a while.