Fig. 6
Download original image
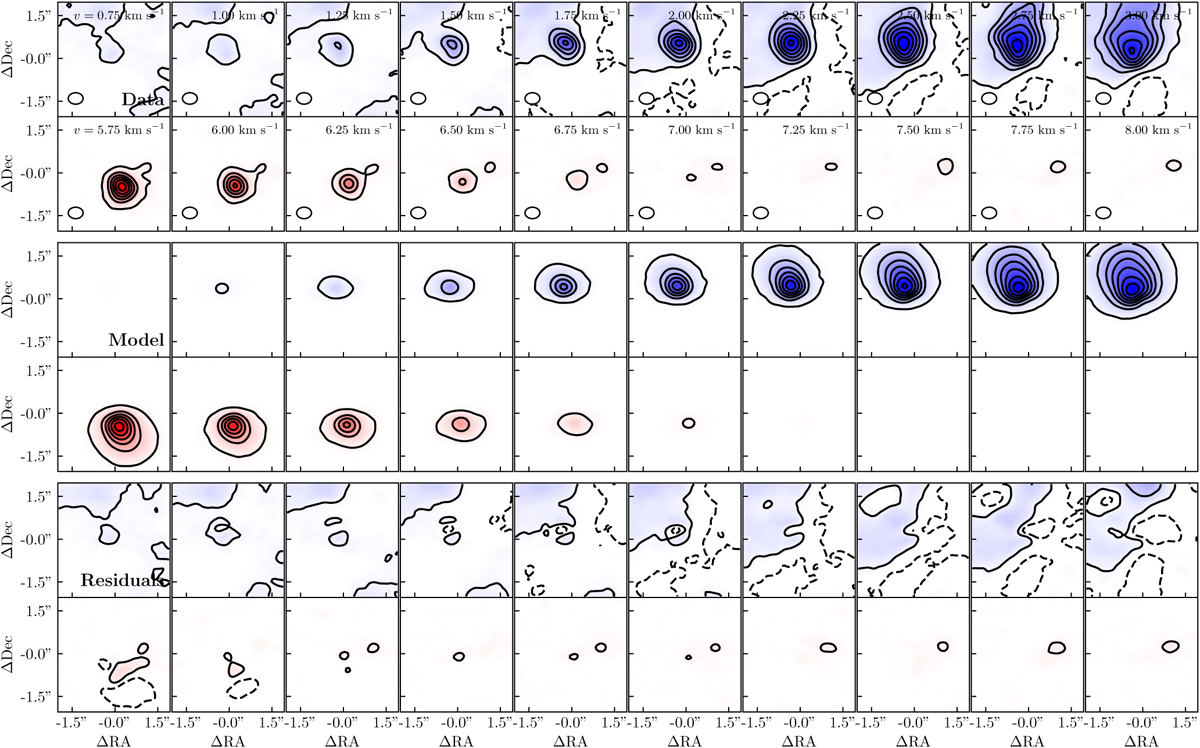
Comparison of the channel maps for VLA 1623A with the best-fit Keplerian disk model. The top two rows show (blue- and redshifted) channel maps from the observations, the middle two rows show the best-fit model, and the bottom two rows show the residuals. The central velocities of the channel maps are indicated in the top two rows. For the model and residual channel maps, we used galario to match baselines and then cleaned the synthetic data with similar imaging parameters as the data. The contours start at 5σ and continue in increments of 20σ, with dashed contours showing negative levels. We excluded channels between 3−5.75 km s−1 as these channels were not fit for VLA 1623A.
Current usage metrics show cumulative count of Article Views (full-text article views including HTML views, PDF and ePub downloads, according to the available data) and Abstracts Views on Vision4Press platform.
Data correspond to usage on the plateform after 2015. The current usage metrics is available 48-96 hours after online publication and is updated daily on week days.
Initial download of the metrics may take a while.