Fig. 4
Download original image
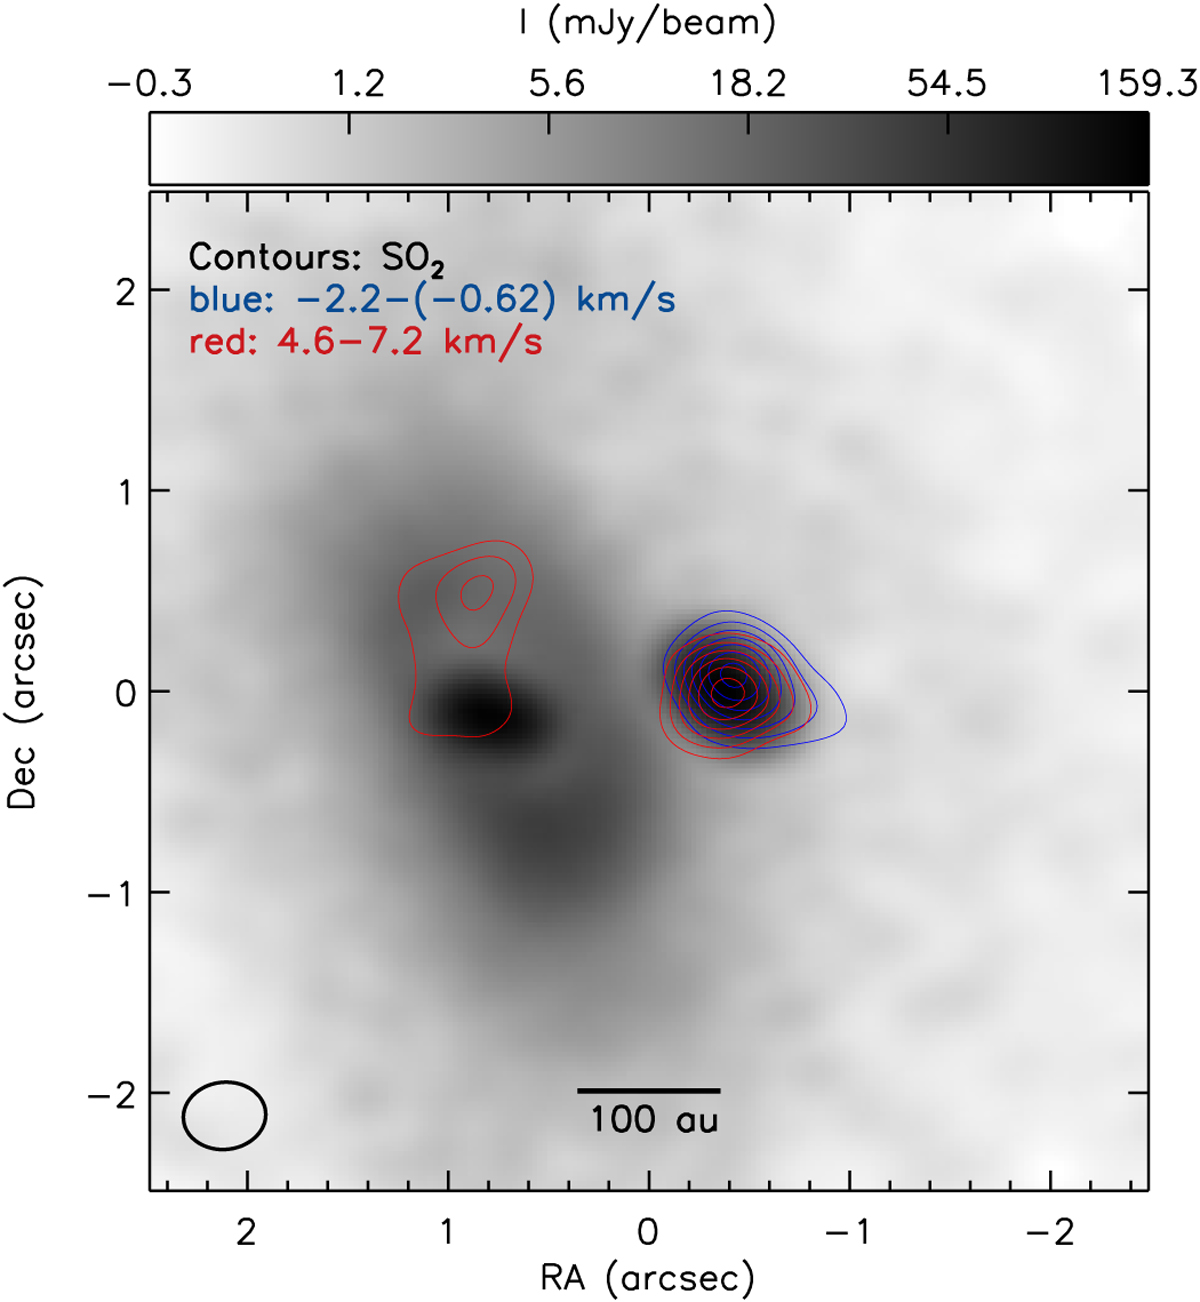
Red- and blueshifted SO2 (8−7) emission overlaid on the dust continuum data. The integrated intensities were generated using the velocity ranges indicated in the legend. Contours correspond to 10, 15, 20, 25, 30, 35, and 40 σ, where σ = 2.5 mJy beam−1 km s−1 for both the blue- and redshifted data. The SO2 map resolution is in the lower-left corner.
Current usage metrics show cumulative count of Article Views (full-text article views including HTML views, PDF and ePub downloads, according to the available data) and Abstracts Views on Vision4Press platform.
Data correspond to usage on the plateform after 2015. The current usage metrics is available 48-96 hours after online publication and is updated daily on week days.
Initial download of the metrics may take a while.