Fig. 3
Download original image
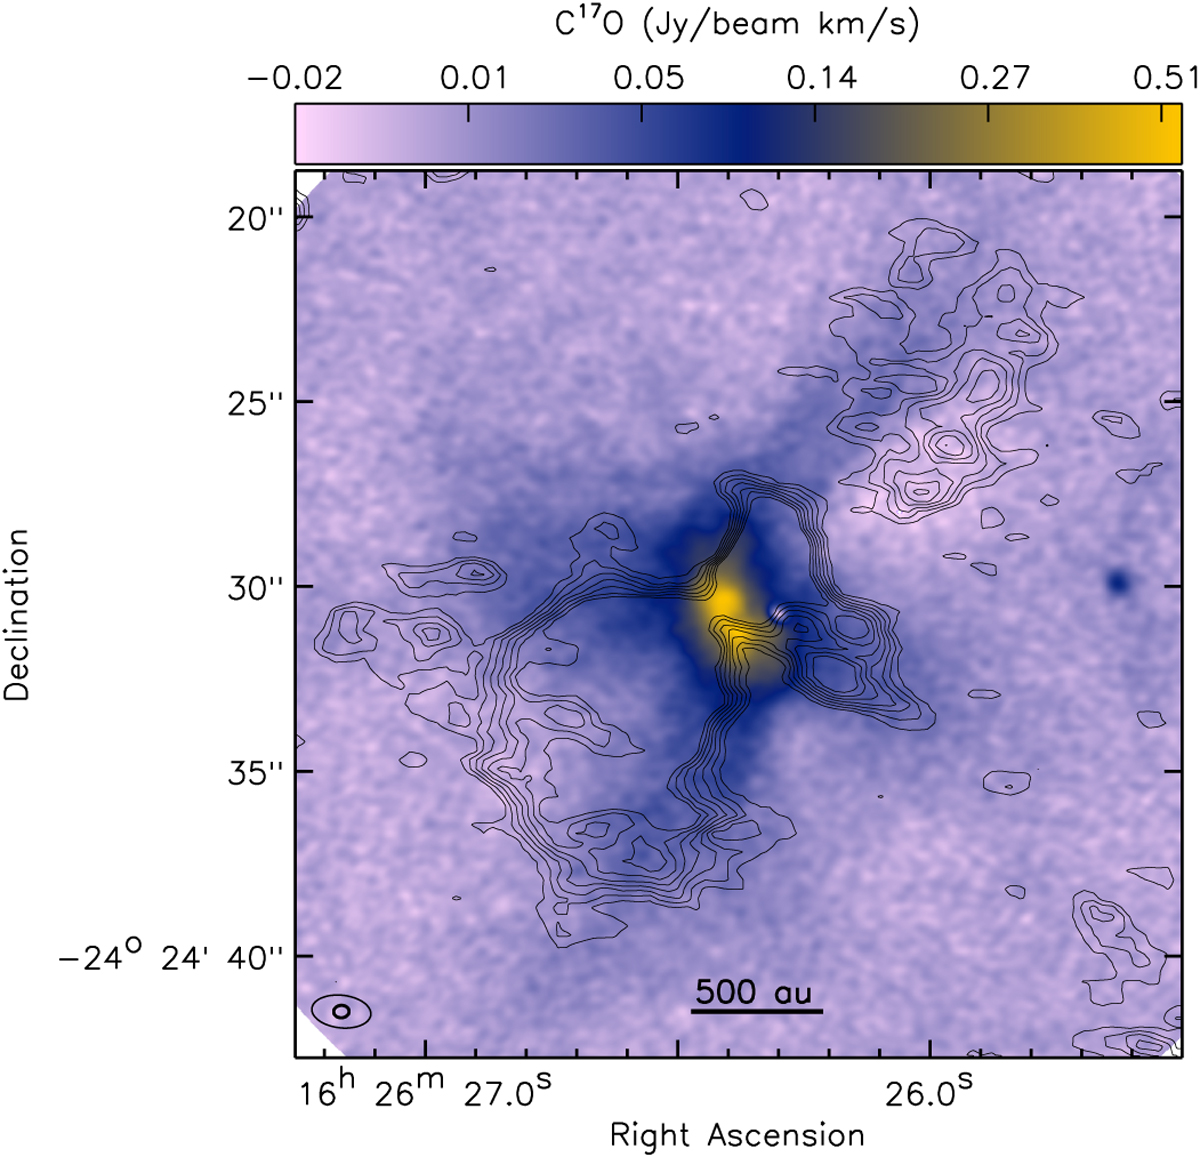
C17O (3−2) data from Fig. 2 with contours of c-C3H2 (217.8 GHz) integrated intensity from Murillo et al. (2018b) to show the outflow. The c-C3H2 integrated intensity data are evaluated over a velocity range of 2.65−5.36 km s−1, and the contours go from 0.02 to 0.05 Jy beam−1 km s−1 in steps of 0.005 Jy beam−1 km s−1. The map resolutions are given in the bottom-left corner.
Current usage metrics show cumulative count of Article Views (full-text article views including HTML views, PDF and ePub downloads, according to the available data) and Abstracts Views on Vision4Press platform.
Data correspond to usage on the plateform after 2015. The current usage metrics is available 48-96 hours after online publication and is updated daily on week days.
Initial download of the metrics may take a while.