Fig. 2
Download original image
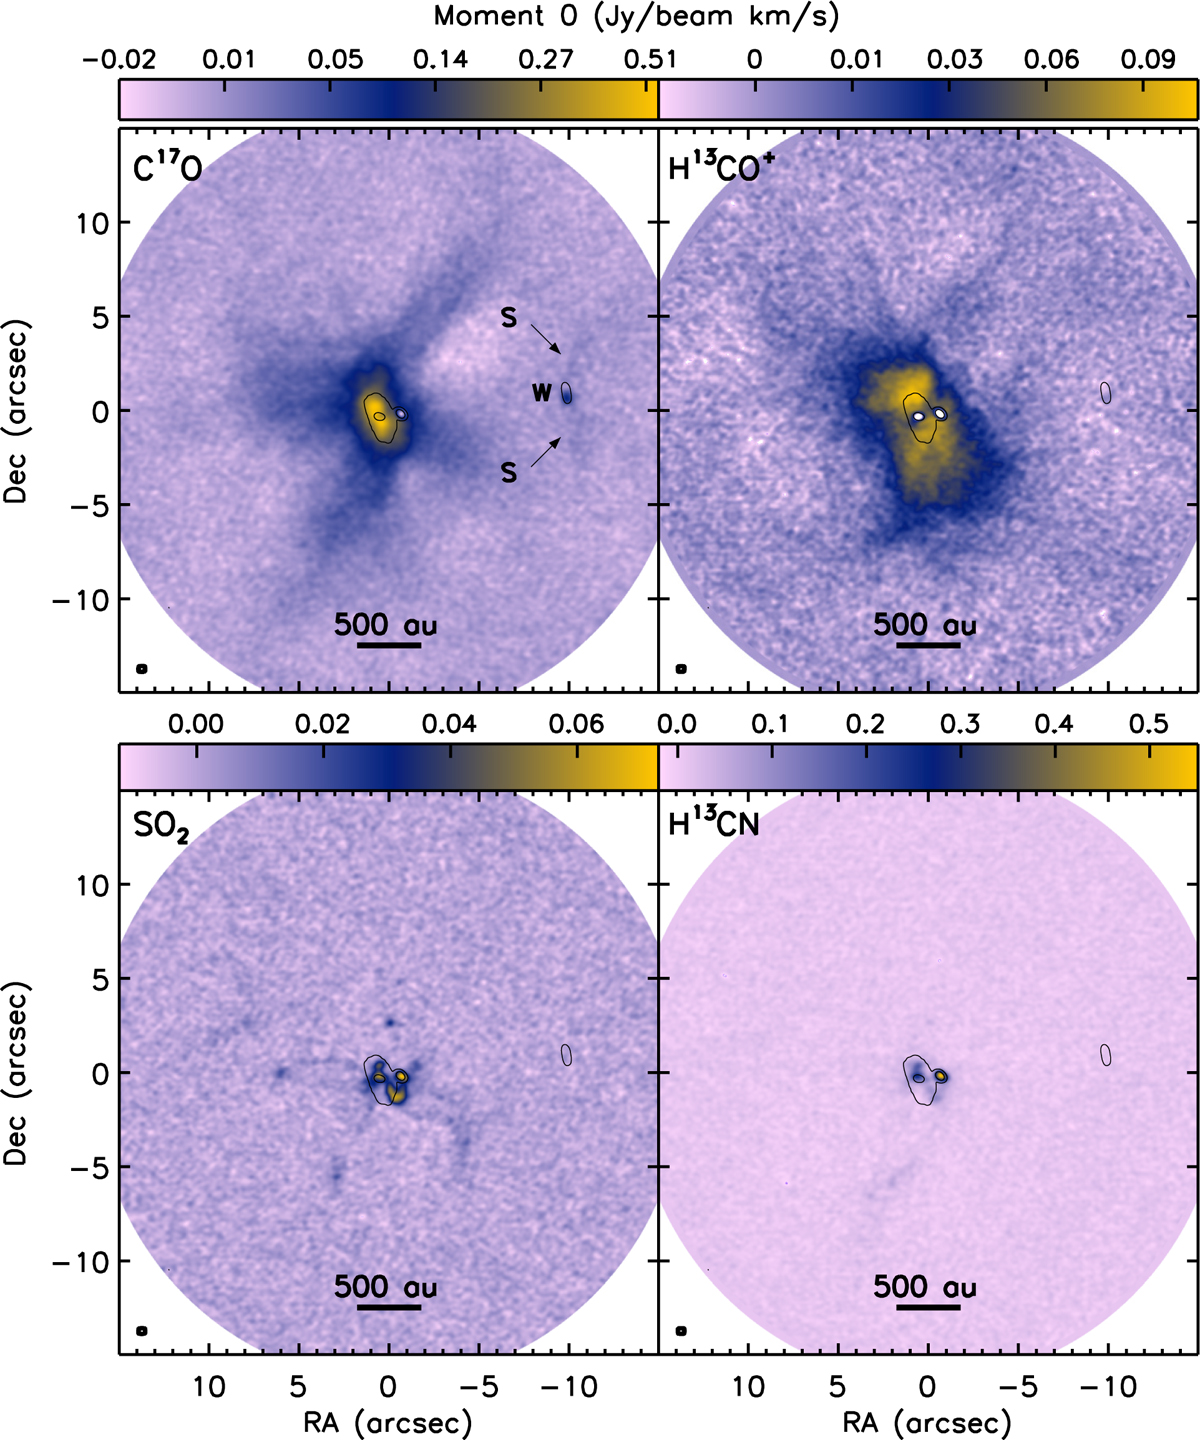
Moment 0 maps (in Jy beam−1 km−1 s−1) of C17O (3−2), H13CO+ (4−3), SO2 (8−7), and (blended) H13CN (4−3). The velocity ranges are given in Table 1. Black contours show the Stokes I continuum at 7 and 49 mJy beam−1. The beam for each map is in the lower-left corner. The upper panels use log scaling to highlight the extended emission, whereas the bottom panels have linear scaling. The line maps are not primary-beam-corrected, for the sake of visualization. The first panel shows labels for VLA 1623W (W) and the velocity streamers (S) from Mercimek et al. (2023) for clarity.
Current usage metrics show cumulative count of Article Views (full-text article views including HTML views, PDF and ePub downloads, according to the available data) and Abstracts Views on Vision4Press platform.
Data correspond to usage on the plateform after 2015. The current usage metrics is available 48-96 hours after online publication and is updated daily on week days.
Initial download of the metrics may take a while.