Fig. A.3
Download original image
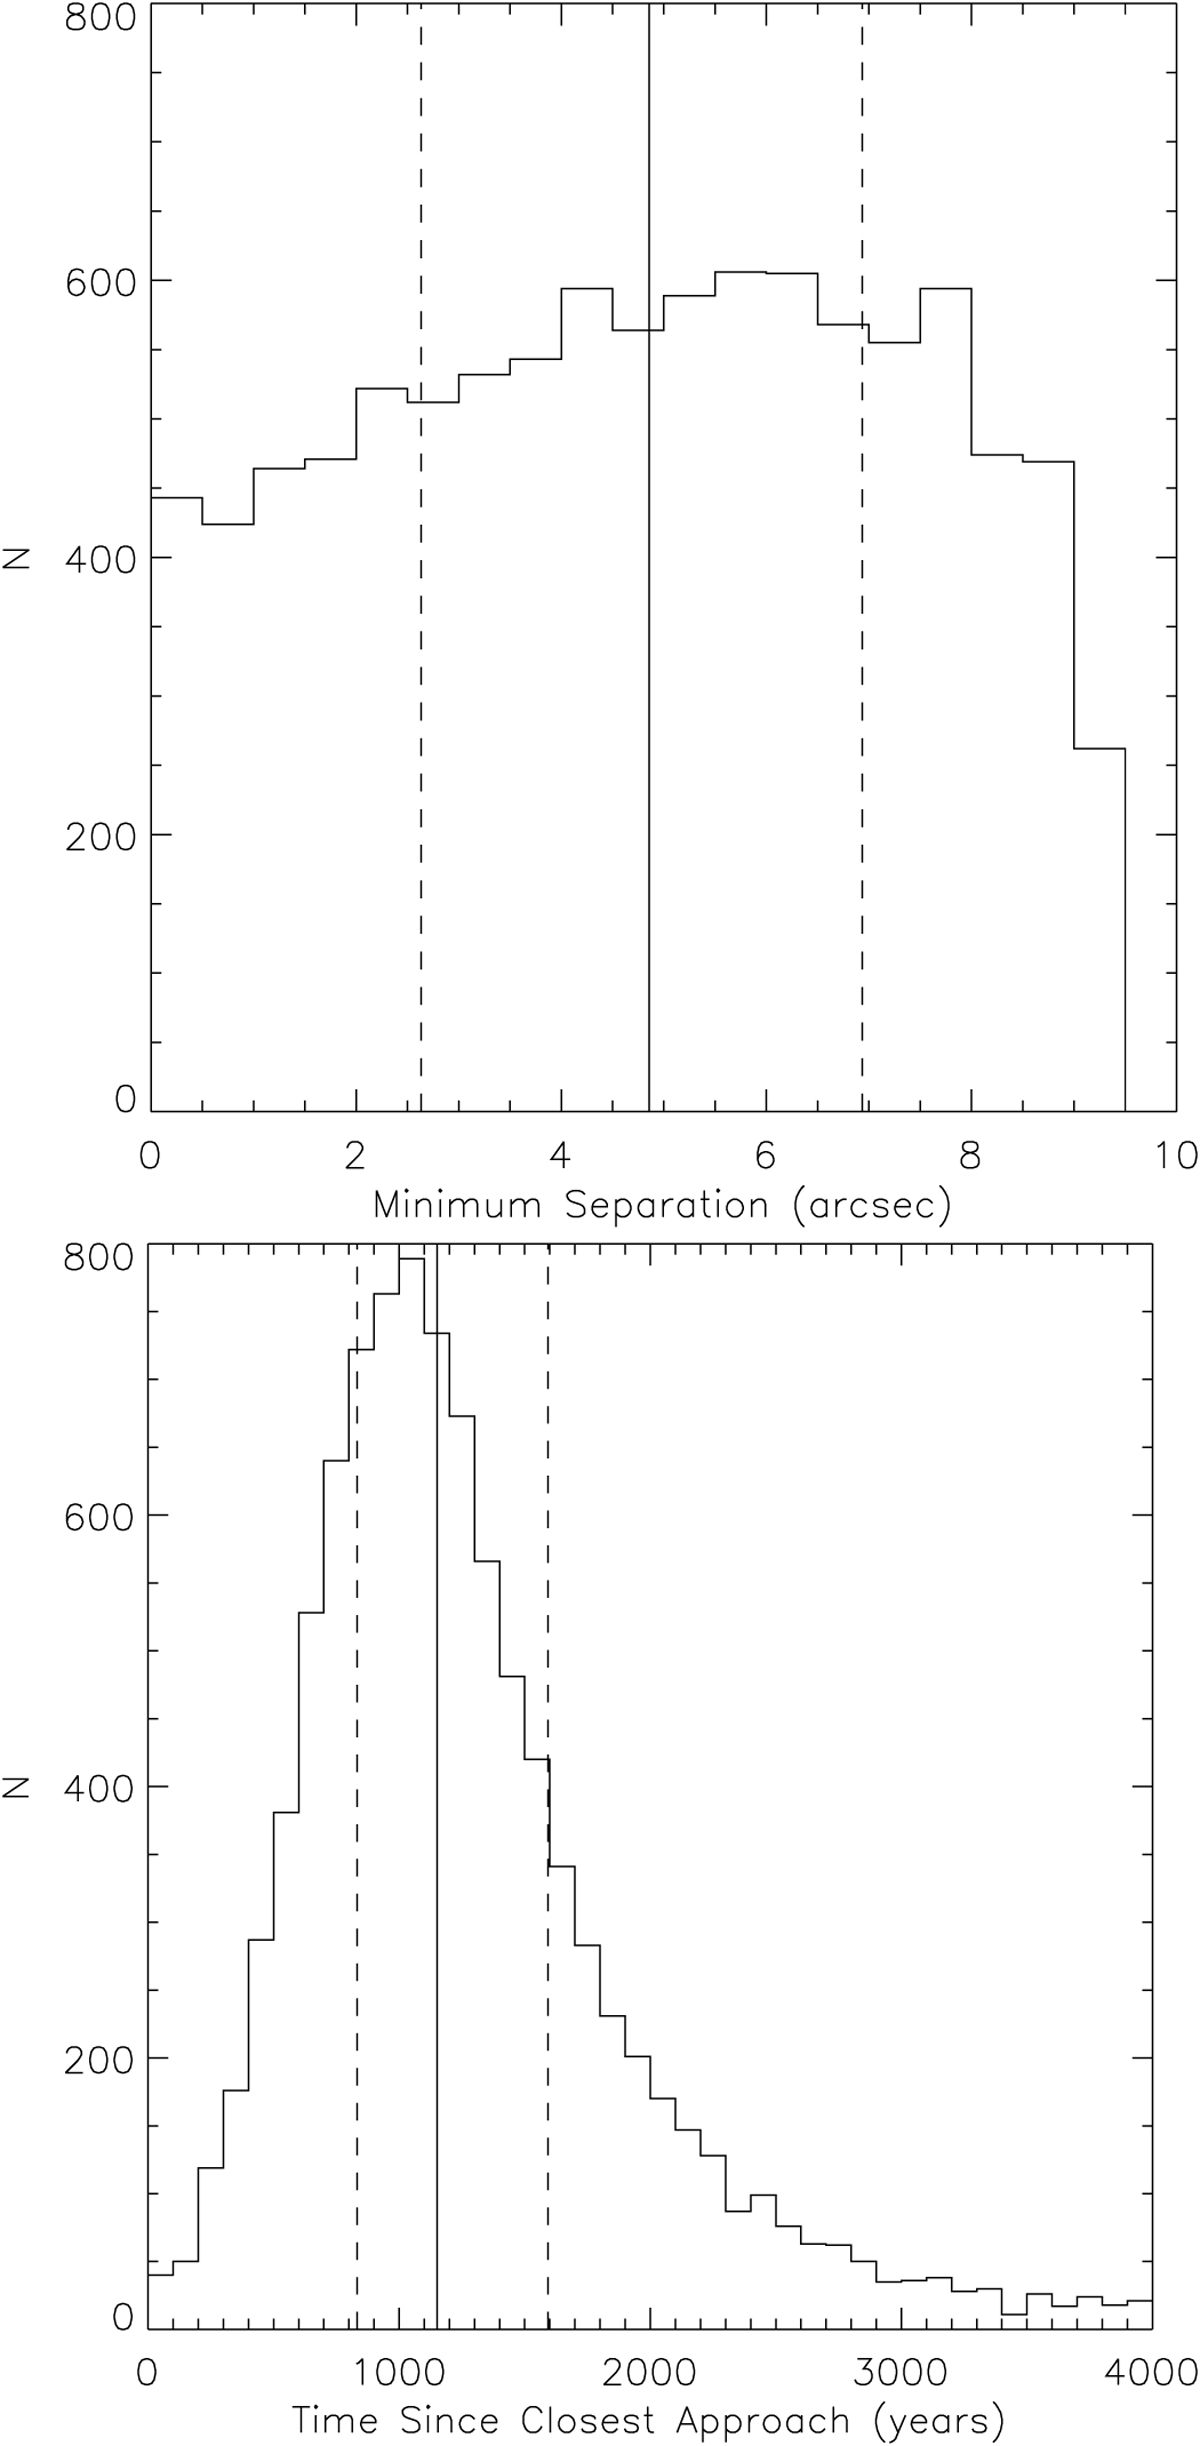
Results for the minimum separation (top) and time of closest approach (bottom) for the Monte Carlo error analysis between the proper motions of VLA 1623B and VLA 1623W. The solid lines show the median values and the dashed lines show the first quartile (25th per-centile) and third quartile (75th percentile) for each distribution. Note that the minimum separation has an upper limit of 9.3 arcsec, corresponding to the current separation between the two sources.
Current usage metrics show cumulative count of Article Views (full-text article views including HTML views, PDF and ePub downloads, according to the available data) and Abstracts Views on Vision4Press platform.
Data correspond to usage on the plateform after 2015. The current usage metrics is available 48-96 hours after online publication and is updated daily on week days.
Initial download of the metrics may take a while.