Open Access
Fig. 12.
Download original image
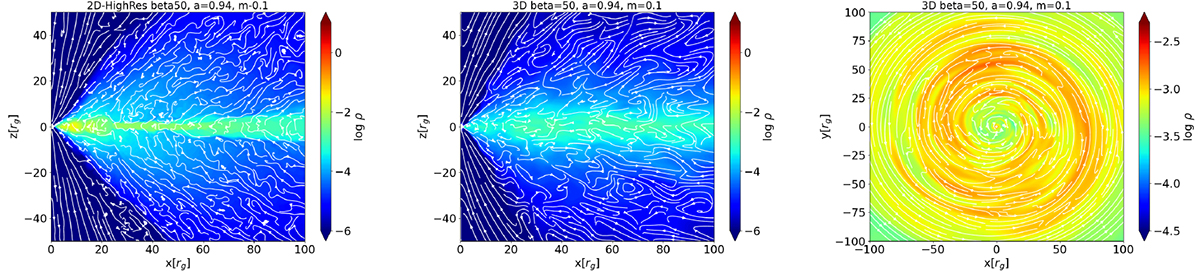
Density profile and magnetic field lines for the 2D-High case (left), the meridional slice at ϕ = 0 (middle), and the equatorial slice of the same quantities for the 3D simulation (right) at the final snapshot.
Current usage metrics show cumulative count of Article Views (full-text article views including HTML views, PDF and ePub downloads, according to the available data) and Abstracts Views on Vision4Press platform.
Data correspond to usage on the plateform after 2015. The current usage metrics is available 48-96 hours after online publication and is updated daily on week days.
Initial download of the metrics may take a while.