Fig. 9
Download original image
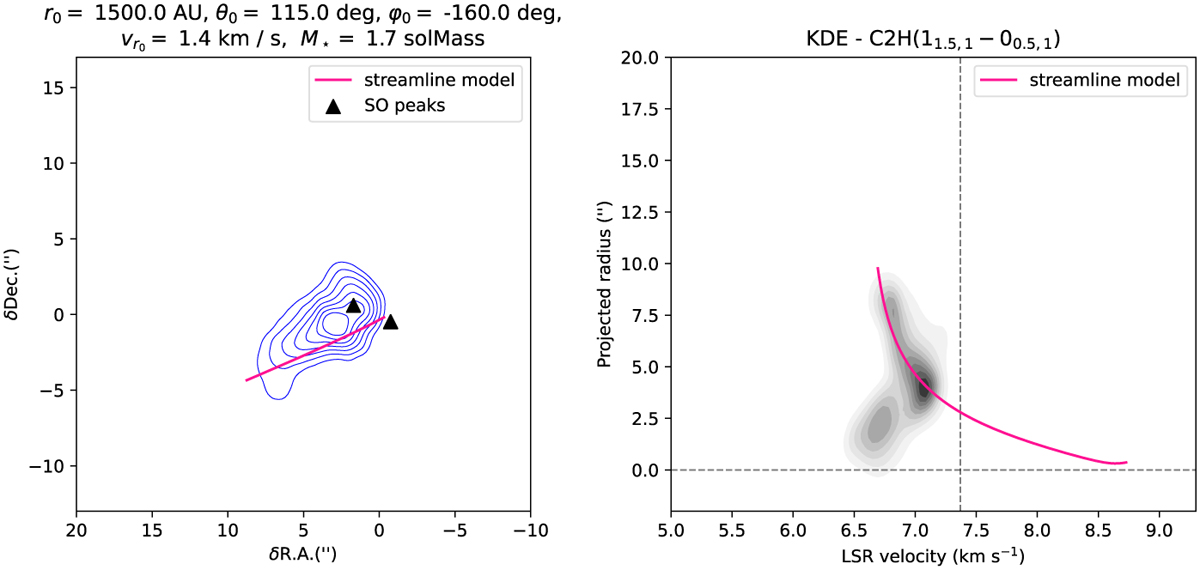
Streamline model of the CS blue-shifted emission for the set of parameters (r0, θ0, φ0, vr,0) = (1500 au, 115°, −160°, 1.4 km s−1) around the axis. See Sect. 4.2.1 for more details. Left: theoretical projected trajectory (in pink) from the streamline model overlayed on the CS blue-shifted emission and the two brightest peaks of the SO emission of Fig. 7. The contour levels are 65σ to 125σ by 10σ steps where σ = 1.0 mJy beam−1 km s−1. Right: theoretical line of sight velocity profile from the streamline model overlayed on the KDE of the C2H blue-shifted velocity map. The vertical dotted line corresponds to the disk vLSR = 7.37 km s−1, the horizontal to the 0″ offset.
Current usage metrics show cumulative count of Article Views (full-text article views including HTML views, PDF and ePub downloads, according to the available data) and Abstracts Views on Vision4Press platform.
Data correspond to usage on the plateform after 2015. The current usage metrics is available 48-96 hours after online publication and is updated daily on week days.
Initial download of the metrics may take a while.