Fig. 7
Download original image
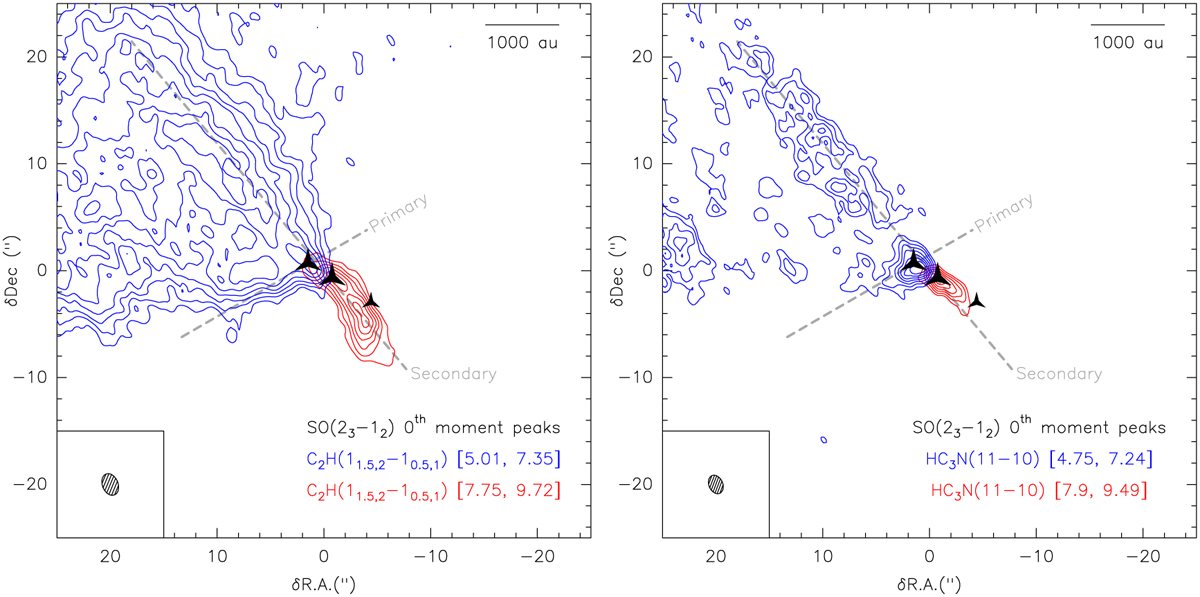
Integrated intensity contours maps of the C2H (11.5,2−00.5,1) emission, on the left, and the HC3N (11−10) emission, on the right. The beam of each line is displayed in the lower left corner of each panel. The three brightest peaks of the SO (23−12) integrated map are shown by black triangles, whose size depends on their intensity relative to the overall maximum. The primary and the secondary axis are represented by the grey dashed-lines. Left: C2H (11.5,2−00.5,1) blue-shifted emission (5.01–7.35 km s−1) in blue contours and red-shifted emission (7.75–9.72 km s−1) in red contours. The levels are 10σ to 33σ by 3σ steps where σ = 0.97 mJy beam−1 km s−1. Right: HC3N (11−10) blue-shifted emission (4.75–7.24 km s−1) in blue contours and red-shifted emission (7.77–9.49 km s−1) in red contours. The contour levels are 7σ to 19σ by 2σ steps where σ = 0.89 mJy beam−1 km s−1.
Current usage metrics show cumulative count of Article Views (full-text article views including HTML views, PDF and ePub downloads, according to the available data) and Abstracts Views on Vision4Press platform.
Data correspond to usage on the plateform after 2015. The current usage metrics is available 48-96 hours after online publication and is updated daily on week days.
Initial download of the metrics may take a while.