Fig. 6
Download original image
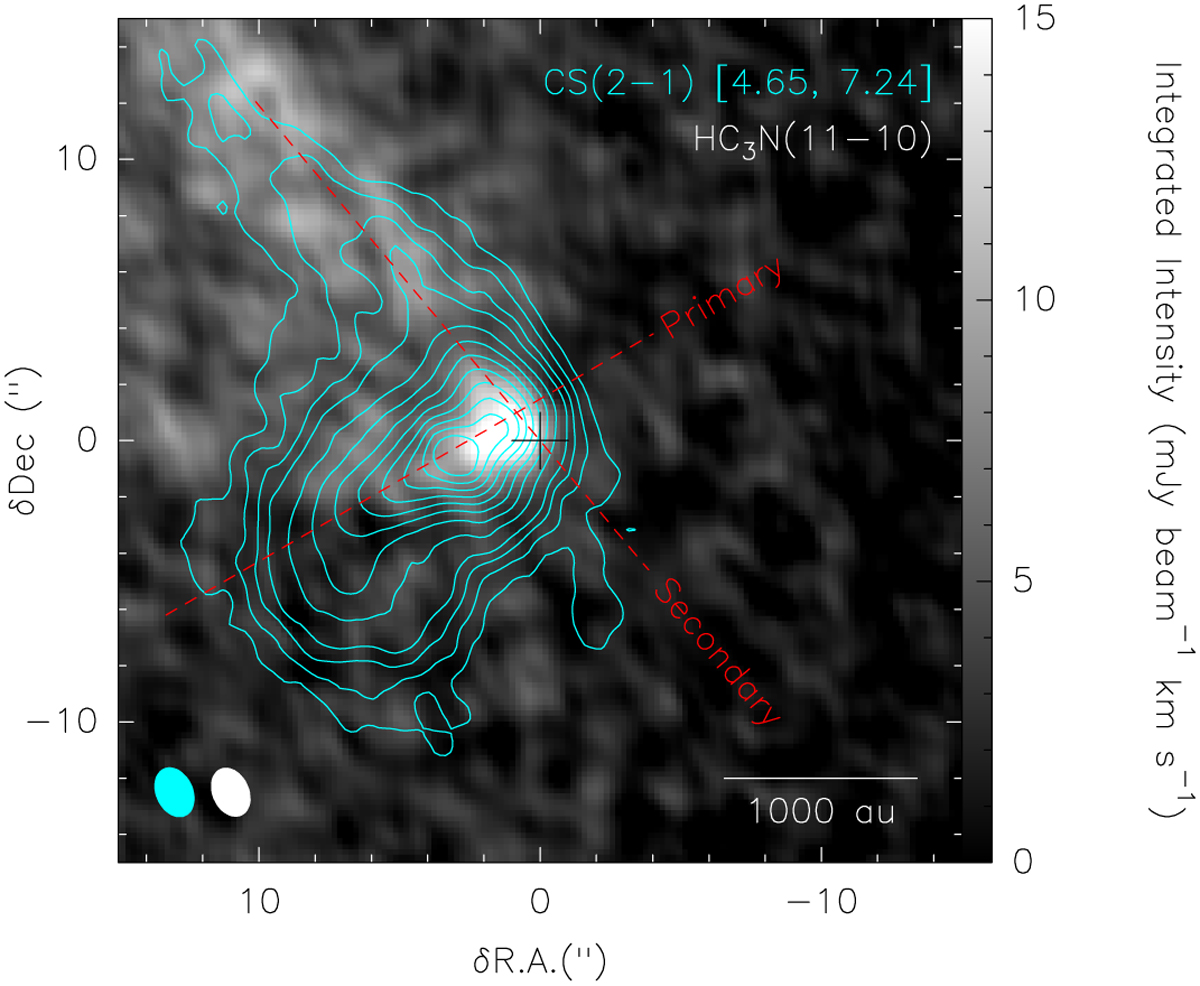
CS(2−1) blue-shifted (4.65 – 7.24 km s−1) integrated intensity map (contours) overlaid on the HC3N(11−10) integrated intensity map (background, colorbar saturated between 0 and 15 mJy beam−1 km s−1). The contour levels are 30σ to 45σ by 5σ steps then 45σ to 125σ by 10σ steps where σ = 1.0 mJy beam−1 km s−1. The two axis of the quadrupolar flow are denoted with dashed red lines. The synthesized beams are displayed in the lower left corner. The scale bar on the bottom right corner indicates 1000 au.
Current usage metrics show cumulative count of Article Views (full-text article views including HTML views, PDF and ePub downloads, according to the available data) and Abstracts Views on Vision4Press platform.
Data correspond to usage on the plateform after 2015. The current usage metrics is available 48-96 hours after online publication and is updated daily on week days.
Initial download of the metrics may take a while.