Fig. 5
Download original image
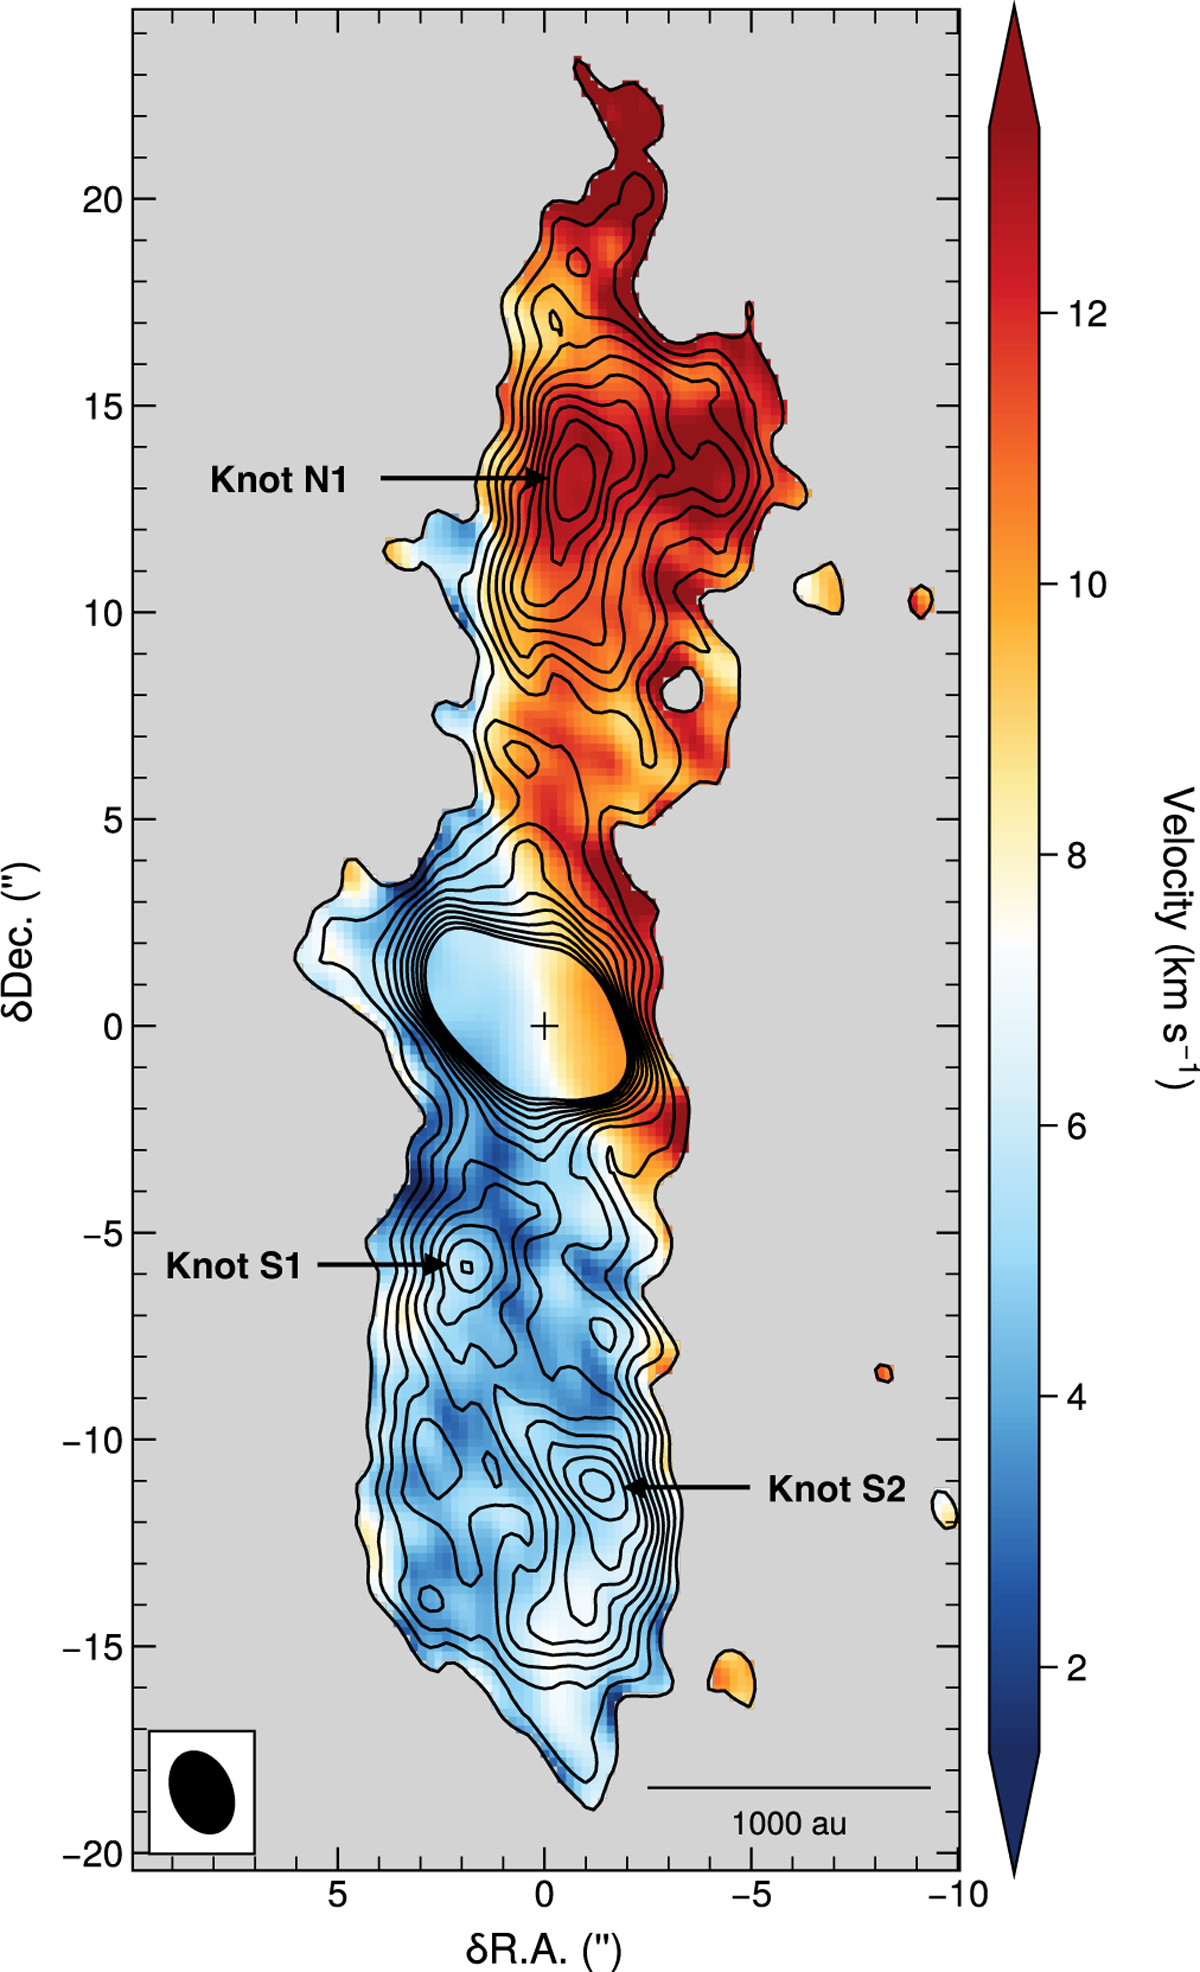
Moment 0 map (contours) overlaid on the moment 1 map (color) for the outflow seen in the HCO+ J=1−0 emission. The contour levels are 5σ to 25σ by 2σ steps where σ = 3.22 mJy beam−1 km s−1. The central velocity is set to the υLSR = 7.37 km s−1. The synthesized beam is displayed in the lower left corner. The scale bar on the bottom right corner indicates 1000 au.
Current usage metrics show cumulative count of Article Views (full-text article views including HTML views, PDF and ePub downloads, according to the available data) and Abstracts Views on Vision4Press platform.
Data correspond to usage on the plateform after 2015. The current usage metrics is available 48-96 hours after online publication and is updated daily on week days.
Initial download of the metrics may take a while.