Fig. C.1
Download original image
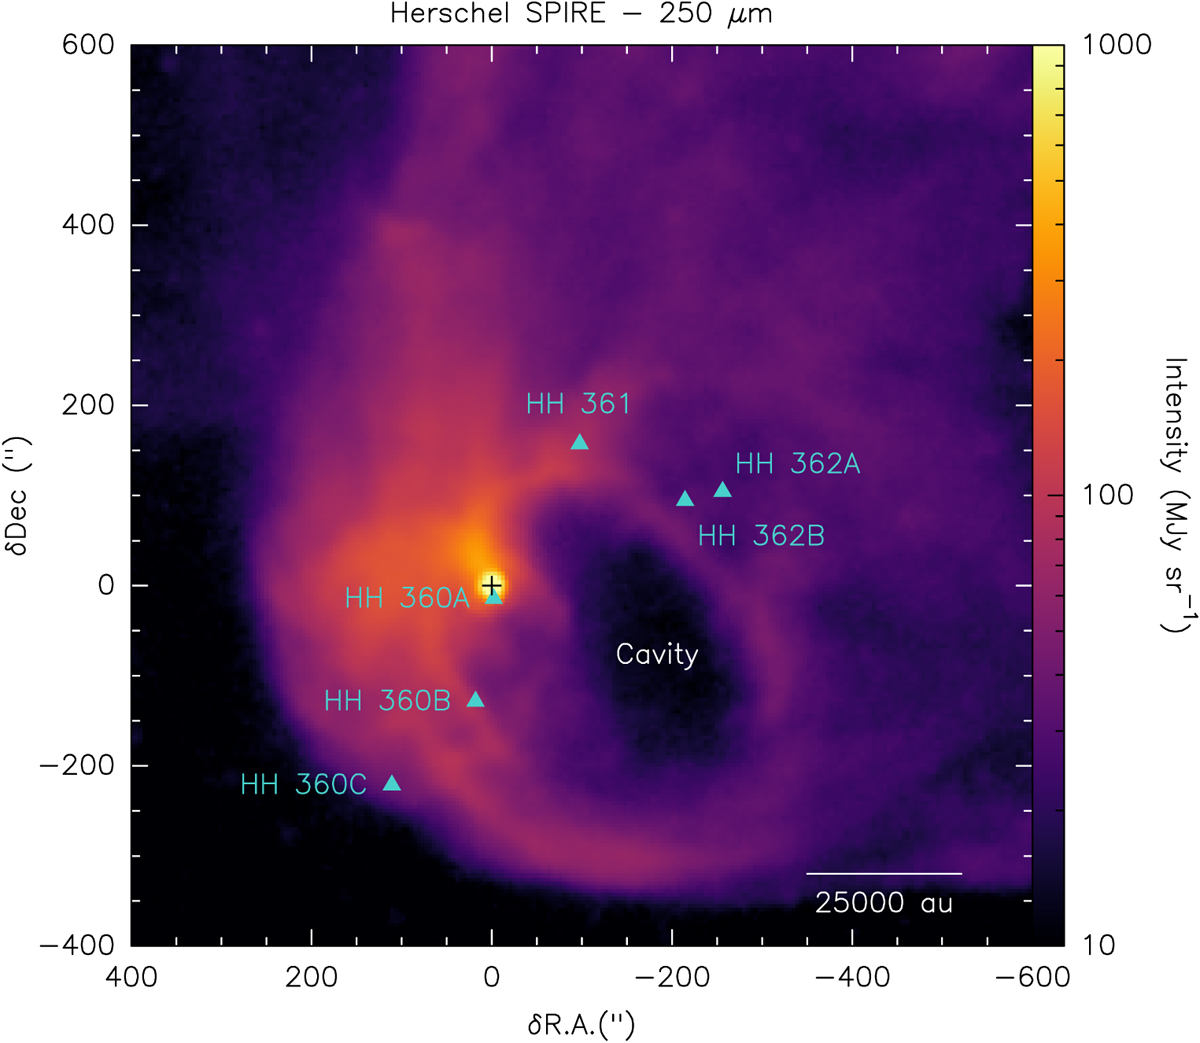
Herschel SPIRE dust map at 250 μm from the Herschel Key Program Guaranteed Time (KPGT, PI: P. Andre). The positions of the HH objects, represented as blue triangles, come from Gomez et al. (1997). The color scale is stretched by the log function and saturated on the 10 – 1000 MIy sr−1 range. The cross denotes L1489 1RS position in (0″, 0″). The scale bar in the bottom right corner indicates 25000 au.
Current usage metrics show cumulative count of Article Views (full-text article views including HTML views, PDF and ePub downloads, according to the available data) and Abstracts Views on Vision4Press platform.
Data correspond to usage on the plateform after 2015. The current usage metrics is available 48-96 hours after online publication and is updated daily on week days.
Initial download of the metrics may take a while.