Fig. 2
Download original image
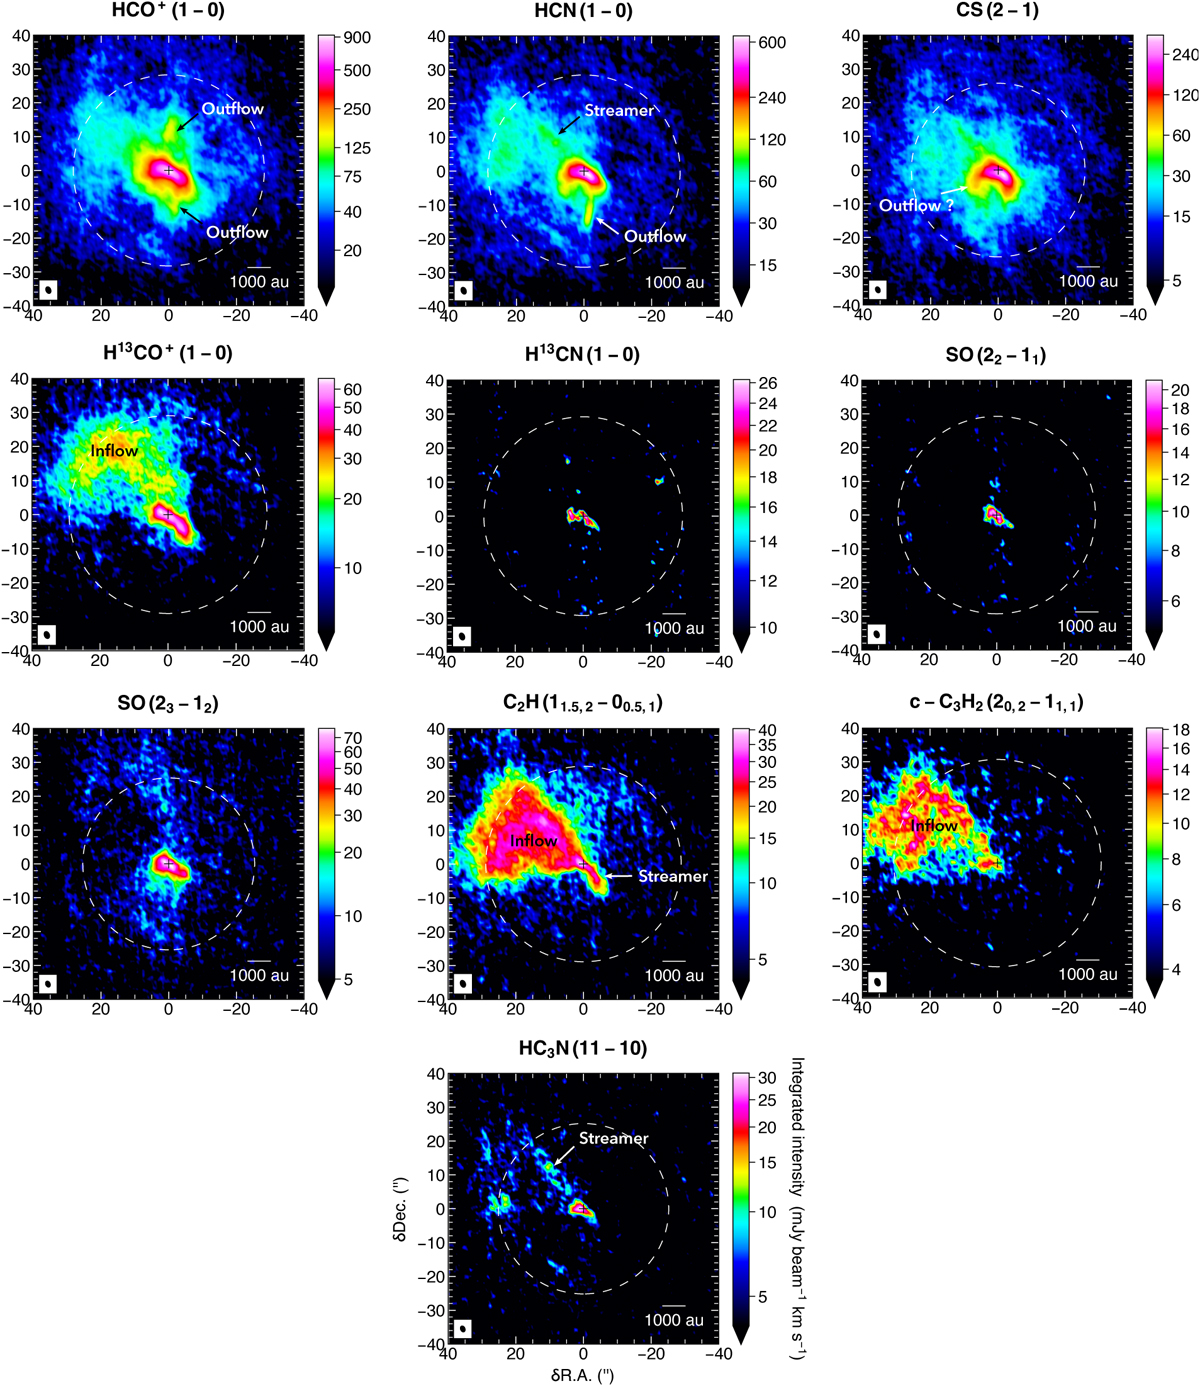
Integrated intensity maps of the primary targeted lines summarized in Table 2. The color scale is stretched by the arcsinh function to make faint extended features more visible. Its minimum is set to 3σ emission. The synthesized beam of each line is displayed in the lower left corner of each panel, the primary beam with white dashed circles, and the scale bar on the bottom right corner indicates 1000 au.
Current usage metrics show cumulative count of Article Views (full-text article views including HTML views, PDF and ePub downloads, according to the available data) and Abstracts Views on Vision4Press platform.
Data correspond to usage on the plateform after 2015. The current usage metrics is available 48-96 hours after online publication and is updated daily on week days.
Initial download of the metrics may take a while.