Fig. 12
Download original image
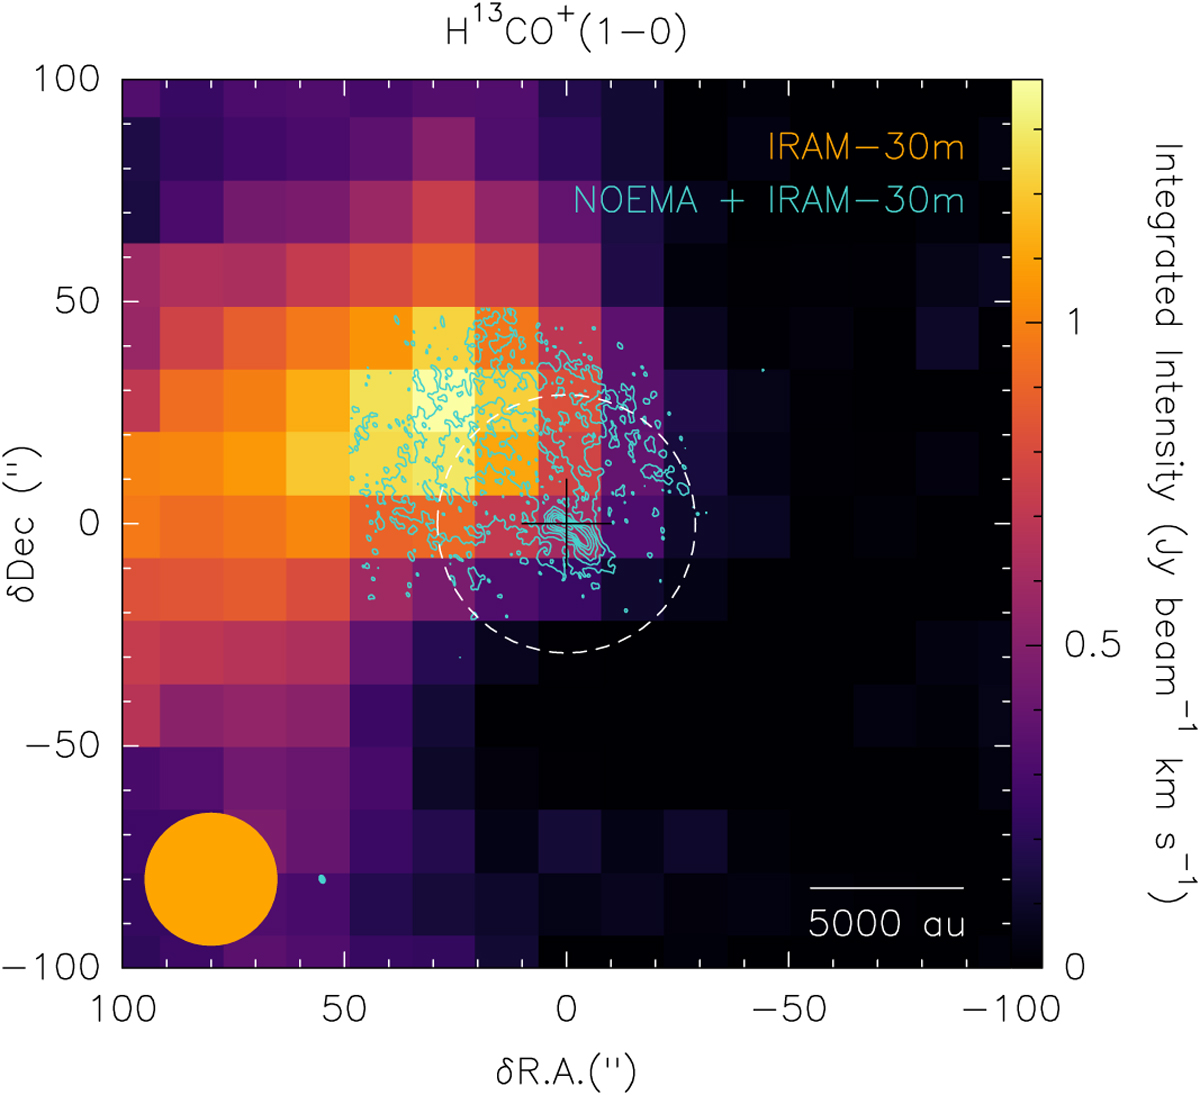
Integrated intensity maps of the H13CO+ emission from the IRAM-30 m (background) and combined (IRAM-30 m + NOEMA) data (contours). The contour levels are 5σ to 55σ by 5σ steps where σ = 1.75 mJy beam−1 km s−1. The dashed white line shows NOEMA’s primary beam. The beams are displayed in the lower left corner. The scale bar on the bottom right corner indicates 5000 au.
Current usage metrics show cumulative count of Article Views (full-text article views including HTML views, PDF and ePub downloads, according to the available data) and Abstracts Views on Vision4Press platform.
Data correspond to usage on the plateform after 2015. The current usage metrics is available 48-96 hours after online publication and is updated daily on week days.
Initial download of the metrics may take a while.