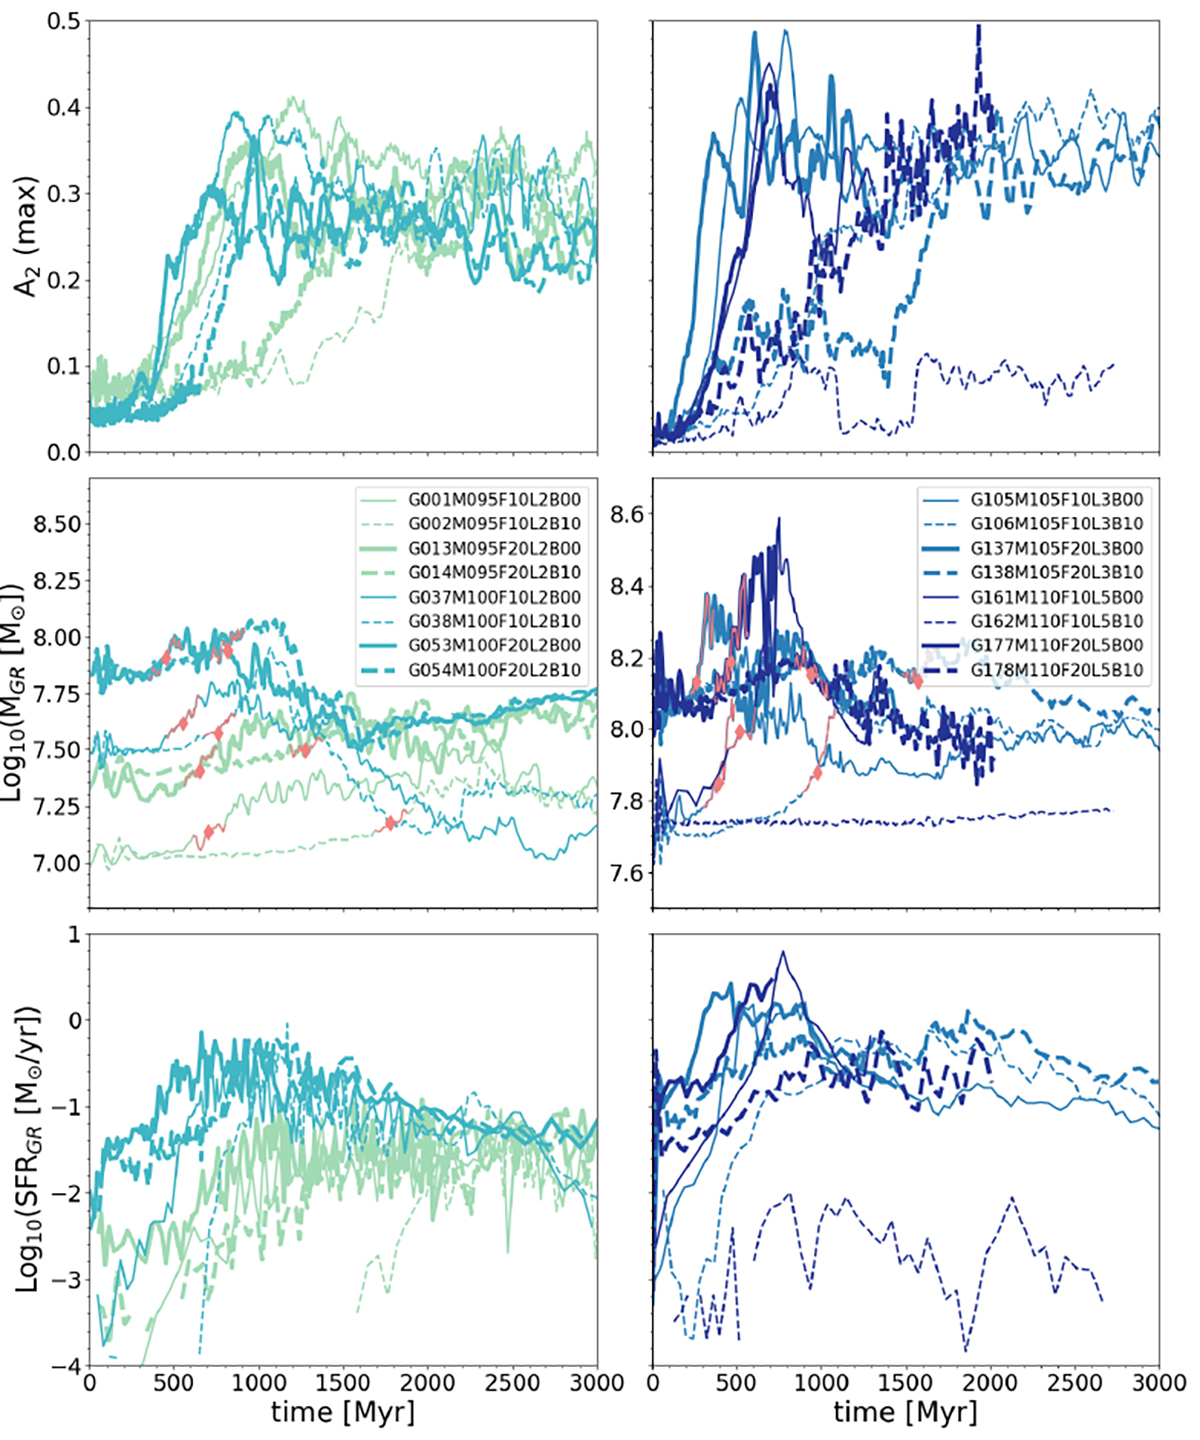
Fig. 8.
Download original image
Evolution of the maximum of the A2 coefficient (top panels), the mass of gas within 1 kpc (middle panels), and the SFR (bottom panels) over time for the 16 simulations (evolved until max 3 Gyr). The colour gradient represents the four stellar masses (9.5, 10, 10.5 and 11 [log(M⊙)]) from the lightest to the most massive. The left column represents the less massive galaxies (9.5 and 10, in green and cyan, respectively) and the right column shows the most massive ones (10.5 and 11, in blue and dark blue, respectively). The solid and dashed curves illustrate the models without and with a bulge, respectively and the thickness of the lines accounts for the gas fraction (10 and 20% for the thinnest and thickest, respectively). The typical bar formation time tbar is also shown (red diamonds) within a time interval of 200 Myr (red part of the curves).
Current usage metrics show cumulative count of Article Views (full-text article views including HTML views, PDF and ePub downloads, according to the available data) and Abstracts Views on Vision4Press platform.
Data correspond to usage on the plateform after 2015. The current usage metrics is available 48-96 hours after online publication and is updated daily on week days.
Initial download of the metrics may take a while.