Fig. 6.
Download original image
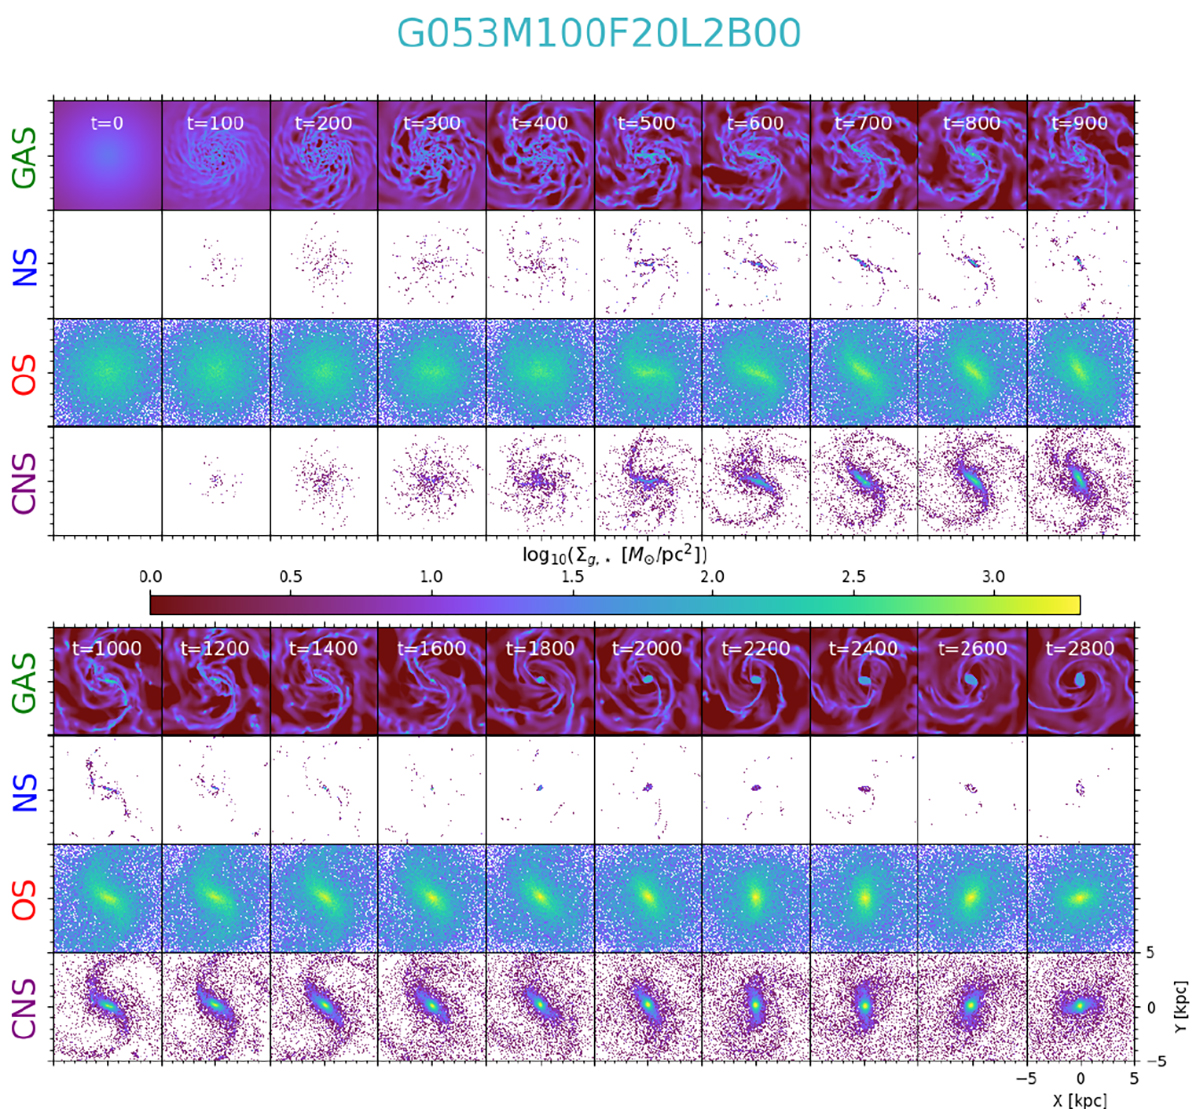
Evolution over time (in millions of years) of the gas and stars of the model labelled G053M100F20L2B00 (one of the sixteen simulations presented in this paper). The two big panels illustrate four main stages, chronologically ordered from top left (0−400 Myr), to top right (500−900 Myr), bottom left (1000−1800 Myr) and bottom right (2000−2800 Myr). Top left: first spiral structures, cooling of the gas, onset of star formation, initial bar structure emerging. Top right: bar strengthening and active local star formation. Bottom left: building of a central concentration of gas (and new stars). Bottom right: growth of the gas reservoir. In each big panel, from top to bottom, we present maps for the gas mass density (GAS), the mass of young stars (≤50 Myr, NS), of old stars (OS) and finally the cumulative mass of new stars (formed since the beginning of the simulation, CNS). Each panel shows a 10 × 10 kpc2 region and the colour scaling is adapted for each panel.
Current usage metrics show cumulative count of Article Views (full-text article views including HTML views, PDF and ePub downloads, according to the available data) and Abstracts Views on Vision4Press platform.
Data correspond to usage on the plateform after 2015. The current usage metrics is available 48-96 hours after online publication and is updated daily on week days.
Initial download of the metrics may take a while.