Fig. 4.
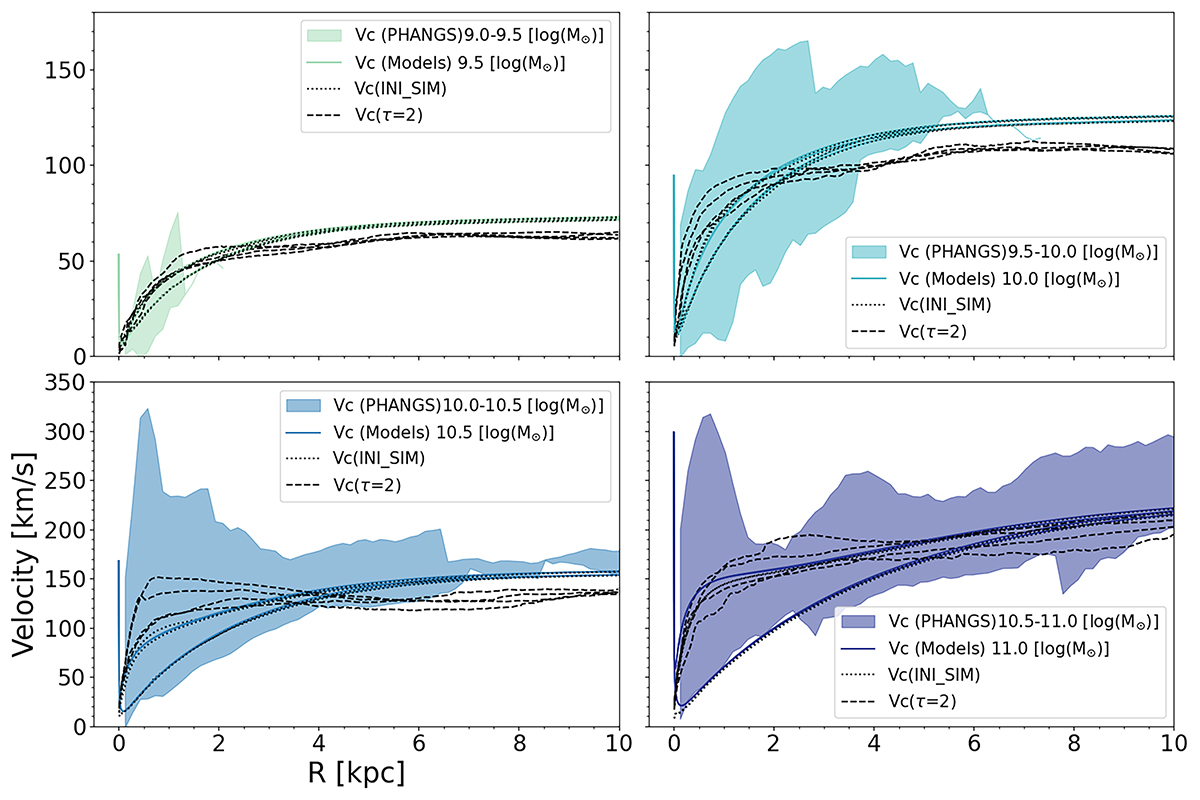
Download original image
Comparison between the observed gas velocity curves of the PHANGS sample (shaded areas) and the circular velocity profiles from our models (solid curves). The vertical lines near R = 0 illustrate the contribution of the central SMBH. The dotted curves represent the circular velocities extracted from the first snapshot (INI_SIM) of each simulation and are consistent with the analytic derivation associated with the initial conditions. The dashed curves represent the circular velocities at τ = 2 (see Sect. 4.3, which corresponds to twice the bar formation time of our simulated galaxies). As mentioned in the text, the PHANGS rotation curves are meant as guidelines to build the initial mass models.
Current usage metrics show cumulative count of Article Views (full-text article views including HTML views, PDF and ePub downloads, according to the available data) and Abstracts Views on Vision4Press platform.
Data correspond to usage on the plateform after 2015. The current usage metrics is available 48-96 hours after online publication and is updated daily on week days.
Initial download of the metrics may take a while.