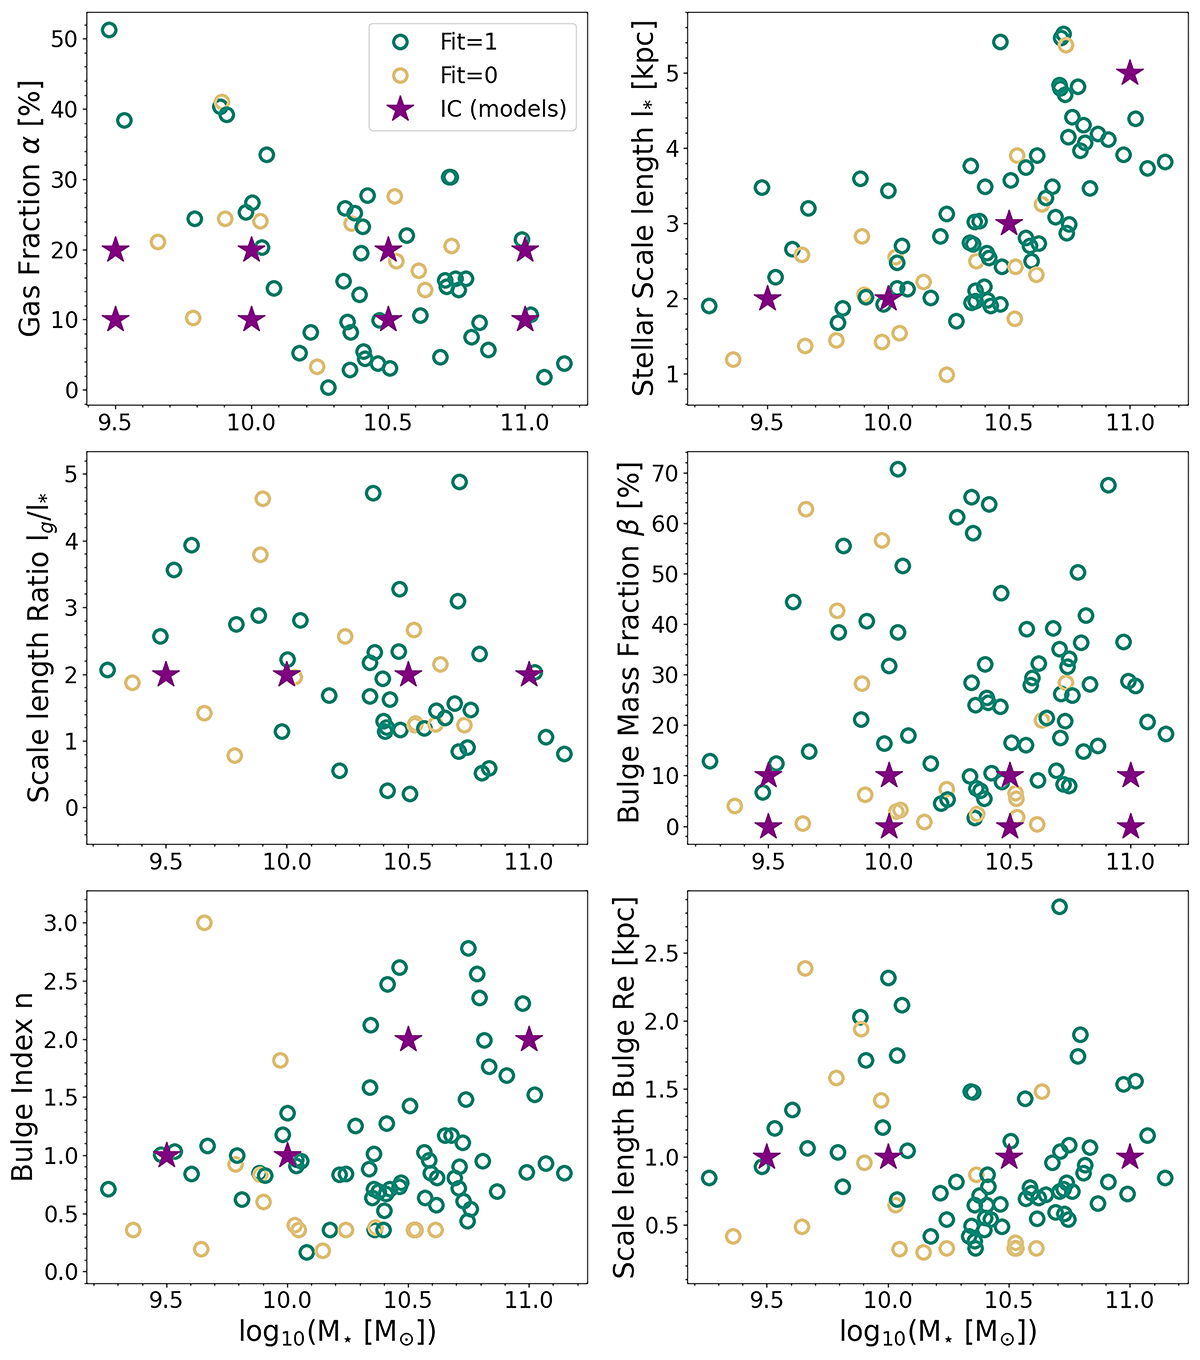
Fig. 3.
Download original image
Results of the fit for different parameters of the models as a function of the stellar mass. Top panels: gas fraction (left) and stellar scale length (right). Middle panels: scale length ratio between the gas and stars (left) and scale length of the stellar bulge (right). Bottom panels: bulge index (left) and bulge mass fraction (right). Colour circles show the actual fits (see the text in Sect. 2.2 for details) to the PHANGS-ALMA sample, while the selected values for our used initial conditions (IC(models)) are shown with purple stars.
Current usage metrics show cumulative count of Article Views (full-text article views including HTML views, PDF and ePub downloads, according to the available data) and Abstracts Views on Vision4Press platform.
Data correspond to usage on the plateform after 2015. The current usage metrics is available 48-96 hours after online publication and is updated daily on week days.
Initial download of the metrics may take a while.