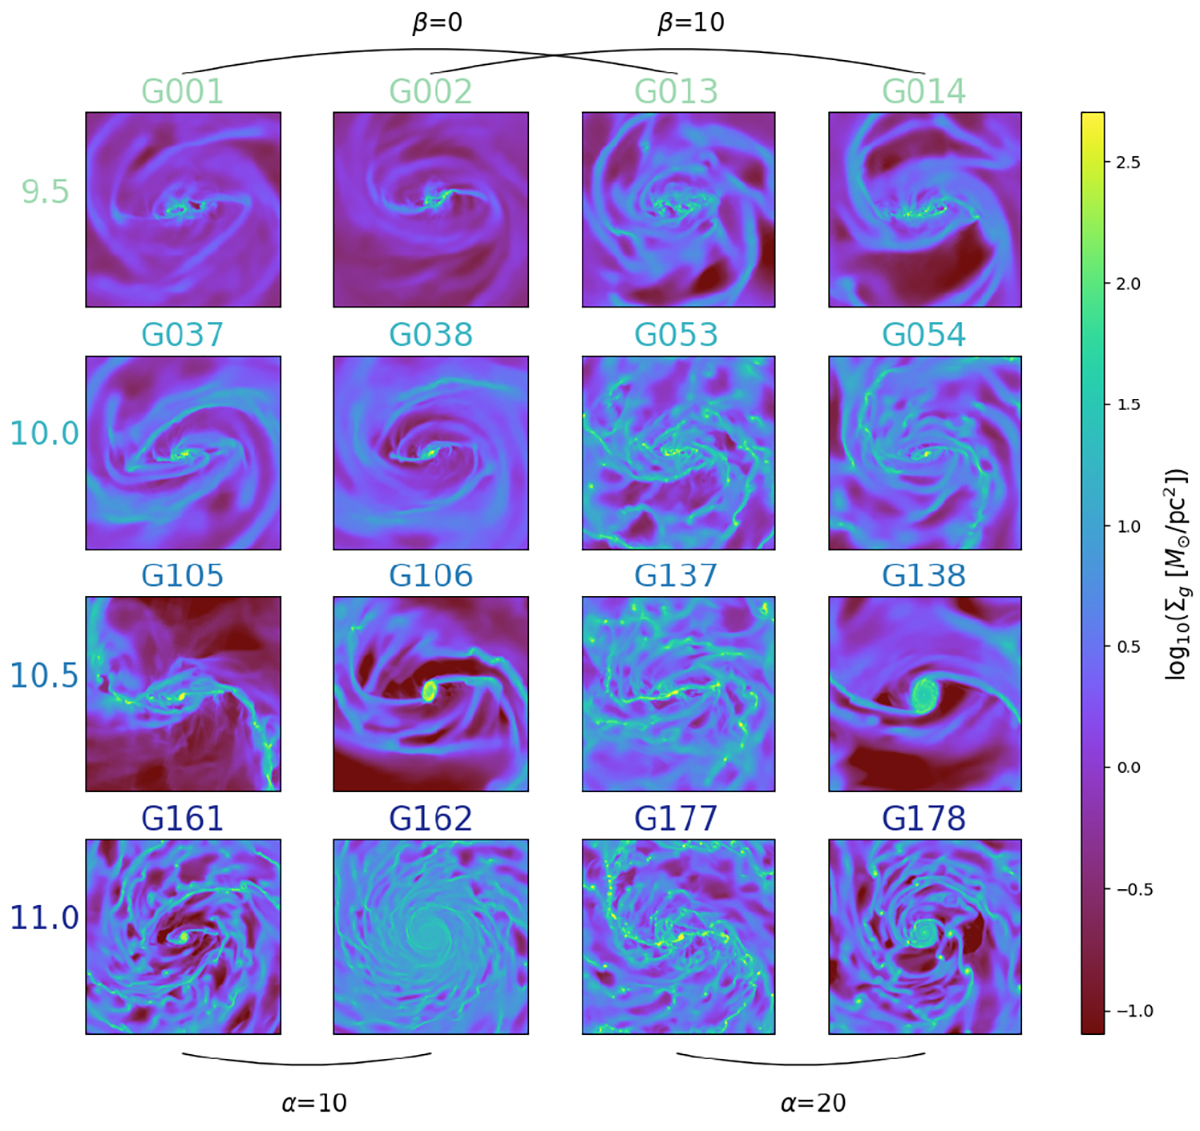
Fig. 12.
Download original image
Density map of gas for the 16 simulations at the corresponding time for which τ = 2. The first three rows show a box of 10 kpc side while the last row shows a box of 20 kpc side. The model numbers are colour-encoded according to the corresponding stellar mass (from the lightest to the most massive from the top to the bottom, i.e. 9.5, 10, 10.5, and 11 in log10(M⊙)). The two left columns illustrate the model with a gas fraction of 10% while the two right columns illustrate the models with a gas fraction of 20%. The odd (even) reference number accounts for models without (with) a bulge.
Current usage metrics show cumulative count of Article Views (full-text article views including HTML views, PDF and ePub downloads, according to the available data) and Abstracts Views on Vision4Press platform.
Data correspond to usage on the plateform after 2015. The current usage metrics is available 48-96 hours after online publication and is updated daily on week days.
Initial download of the metrics may take a while.