Fig. 11.
Download original image
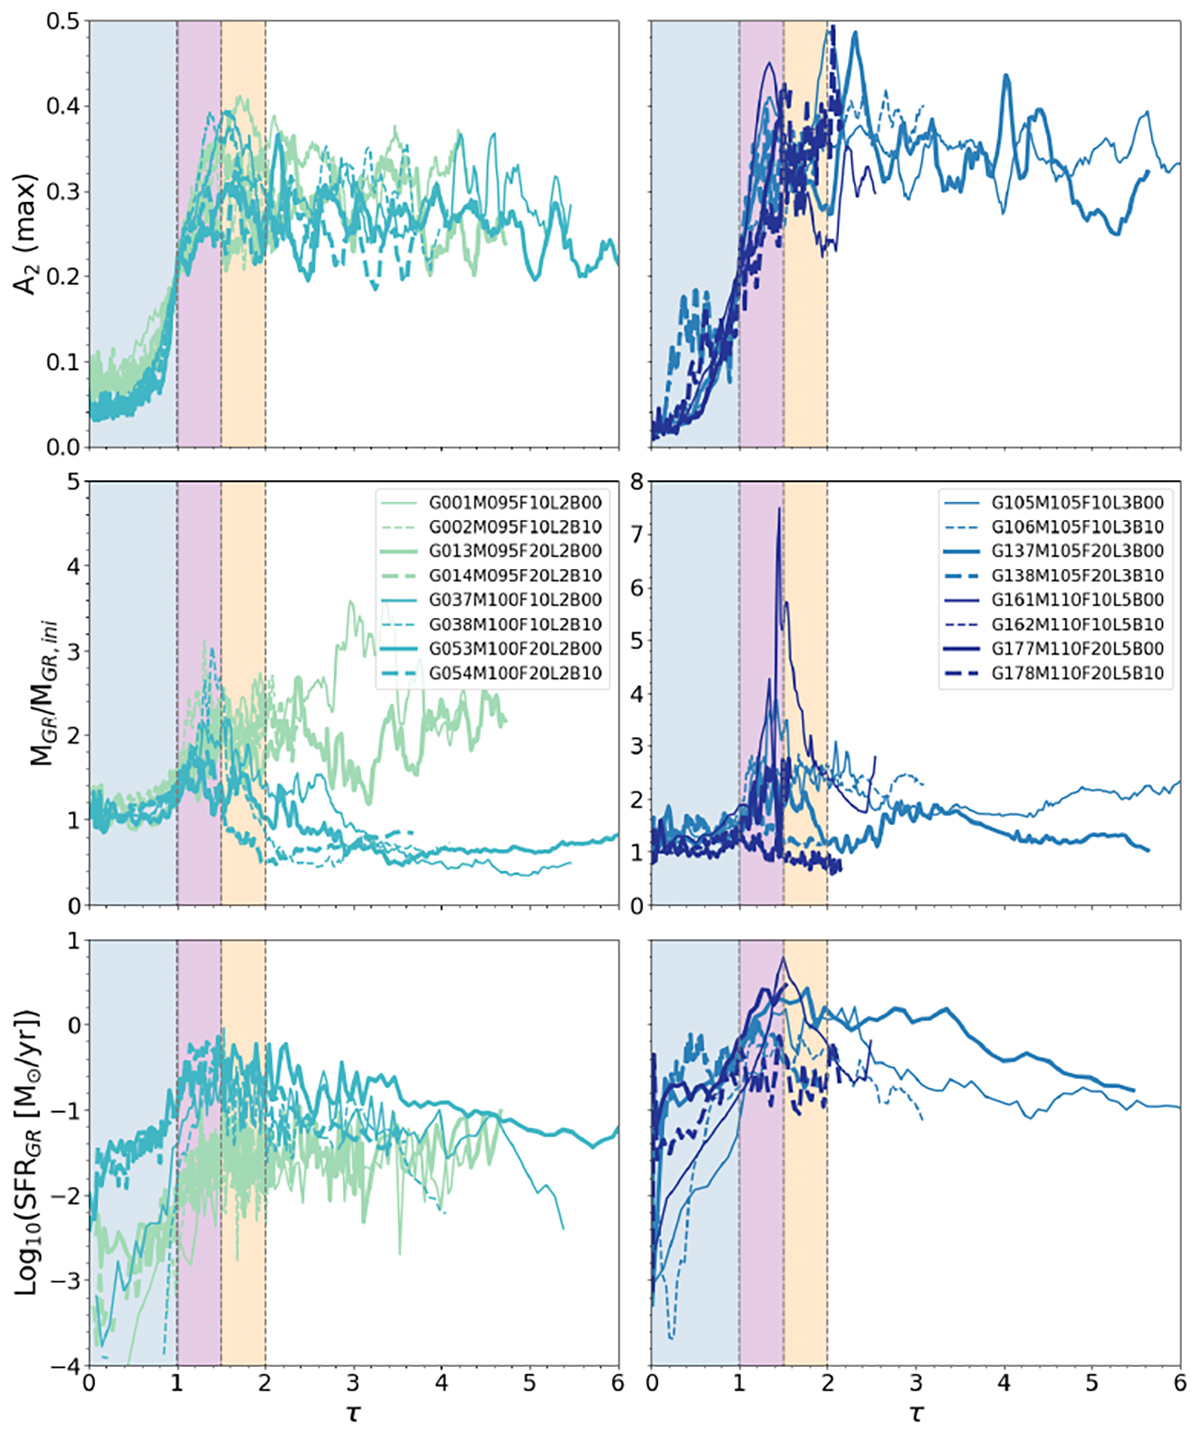
Evolution of the maximum of the A2 coefficient (top panels), the mass of gas within the central 1 kpc normalised by the initial mass of gas within the same radius (middle panels), and the SFR (bottom panels). The evolution is shown through the dimensionless parameter τ, which is the ratio between the time of the simulations and the corresponding time when A2 reaches the value of 0.2. The dashed vertical lines and shaded coloured areas show peculiar values of τ we use to describe the phases of the fuelling (i.e, τ ∈ 0 − 1 (blue area); τ ∈ 1 − 1.5 (purple area); τ ∈ 1.5 − 2 (orange area)). The colour code and the meaning of the different lines are the same as in Fig. 8.
Current usage metrics show cumulative count of Article Views (full-text article views including HTML views, PDF and ePub downloads, according to the available data) and Abstracts Views on Vision4Press platform.
Data correspond to usage on the plateform after 2015. The current usage metrics is available 48-96 hours after online publication and is updated daily on week days.
Initial download of the metrics may take a while.