Fig. 10.
Download original image
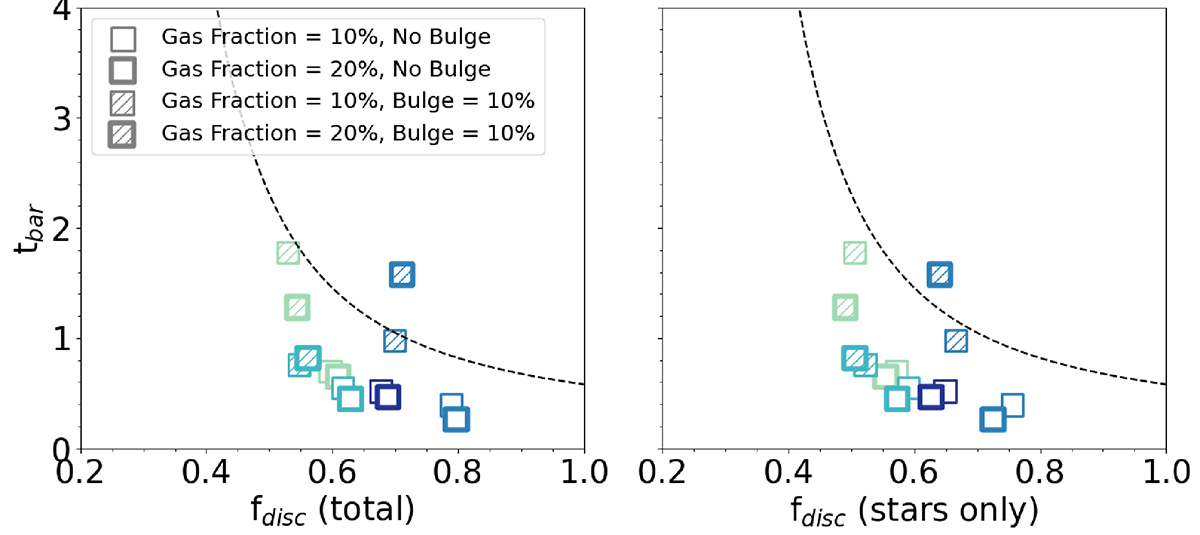
Typical bar formation time tbar as a function of fdisc as defined in Bland-Hawthorn et al. (2023). The dashed lines show the relation given by Fujii et al. (2019). fdisc is derived using the sole stellar disc (right panel) or the total baryonic content (i.e. stars and gas; left panel). In the right panel, fdisc (stars only) decreases when the gas fraction increases as expected (the relative contribution of the stellar disc gets smaller), while in the left panel, fdisc (total) increases with the gas fraction (as the total baryonic contribution increases). As in Fig. 9, the size of each square represents 200 Myr (i.e. ±100 Myr), hence illustrating the uncertainty in tbar (see Sect. 4.2).
Current usage metrics show cumulative count of Article Views (full-text article views including HTML views, PDF and ePub downloads, according to the available data) and Abstracts Views on Vision4Press platform.
Data correspond to usage on the plateform after 2015. The current usage metrics is available 48-96 hours after online publication and is updated daily on week days.
Initial download of the metrics may take a while.