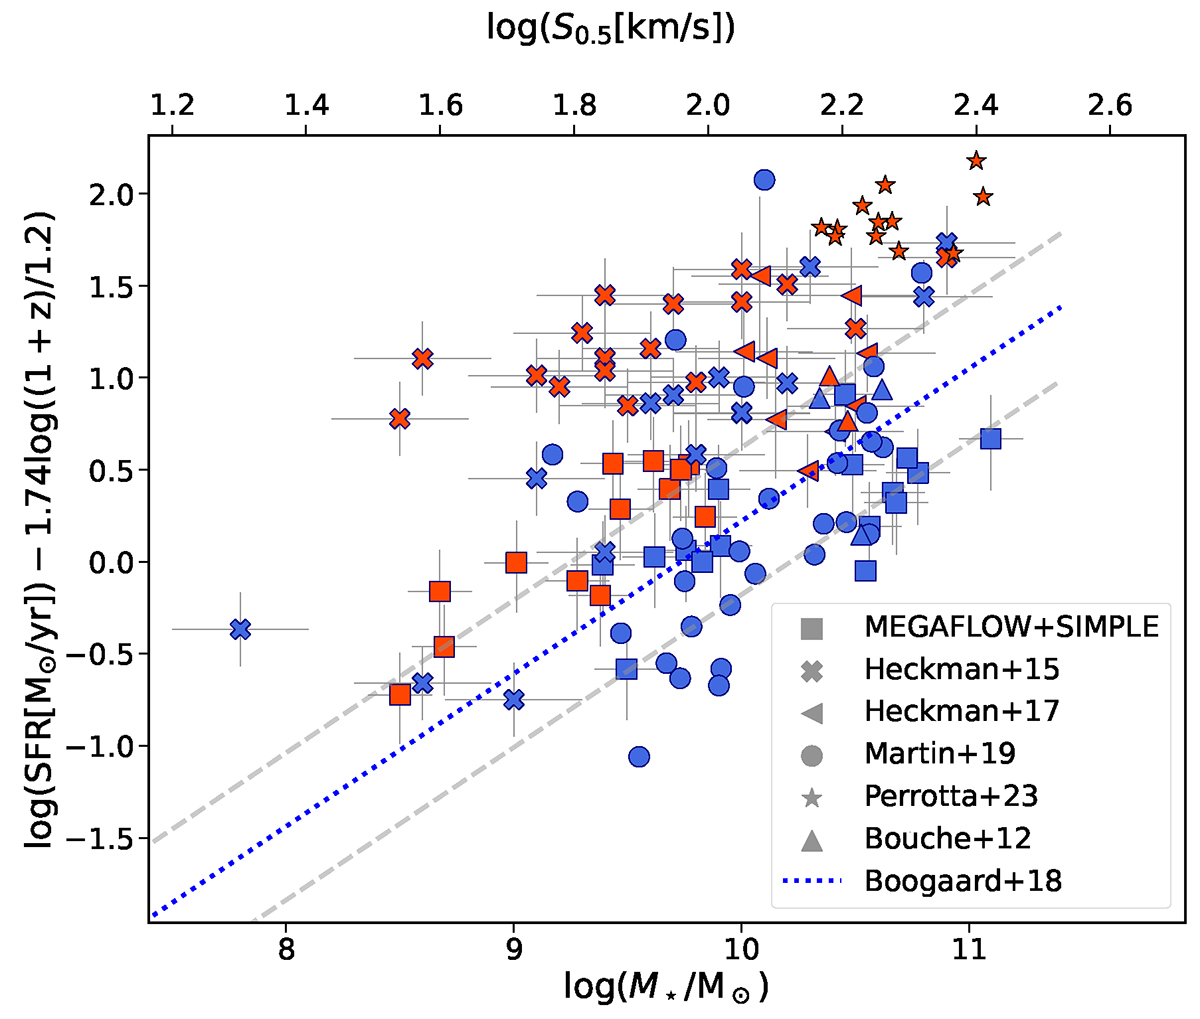
Fig. 1.
Download original image
SFR-M⊙ main sequence. The data points are normalized for redshift evolution to z = 0.2. All the SFRs are also corrected to have the same initial mass function (a Chabrier 2003 IMF). The Boogaard et al. (2018) MS relation is represented by the dotted blue line along with its intrinsic scatter of 0.4 dex (gray dashed lines). As described in the text (Sect. 3.1), red (blue) galaxies are considered strong (weak) outflow cases.
Current usage metrics show cumulative count of Article Views (full-text article views including HTML views, PDF and ePub downloads, according to the available data) and Abstracts Views on Vision4Press platform.
Data correspond to usage on the plateform after 2015. The current usage metrics is available 48-96 hours after online publication and is updated daily on week days.
Initial download of the metrics may take a while.