Fig. 3
Download original image
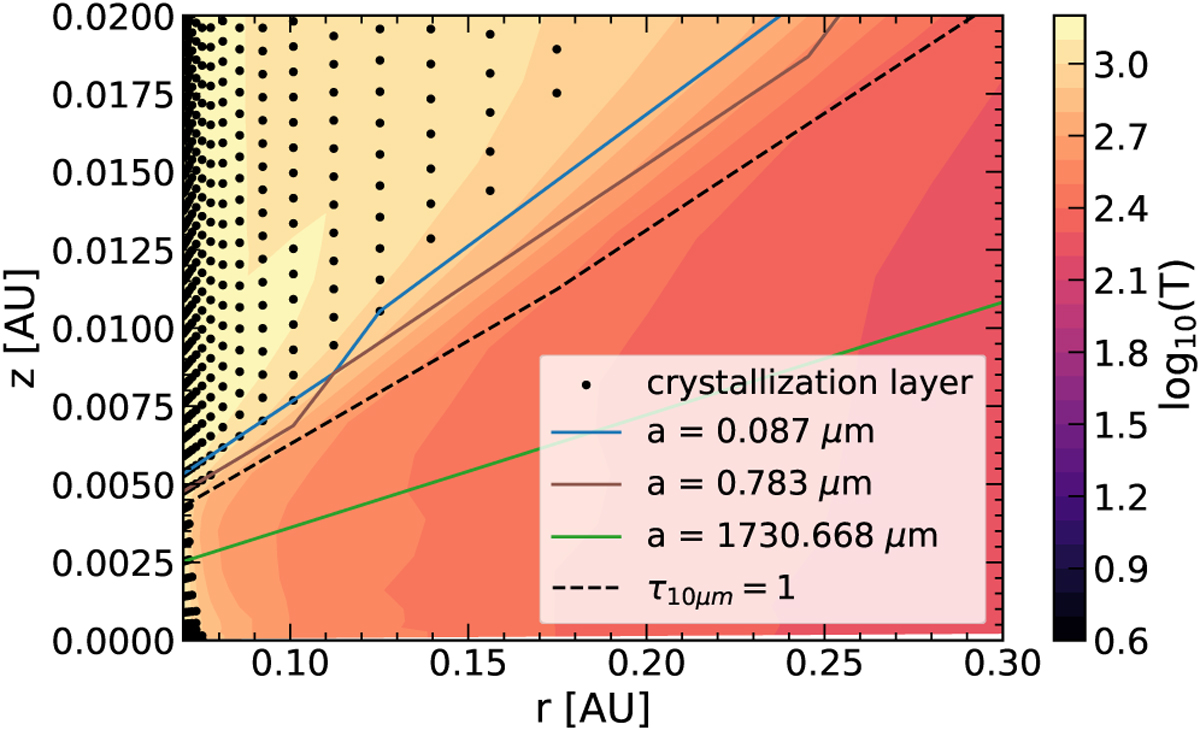
Crystallization region and dust layers of different grain sizes with vertical optical depth τv = 1 at 10 μm. The temperature profile in r and z from MCMax is shown in the colormap, and the black dotted region is the crystallization region. Solid lines are the maximum heights of the dust layers, where the local St = 10−2 for 0.087, 0.783, and 1730 μm dust. The dashed line represents τv = 1 at 10 μm.
Current usage metrics show cumulative count of Article Views (full-text article views including HTML views, PDF and ePub downloads, according to the available data) and Abstracts Views on Vision4Press platform.
Data correspond to usage on the plateform after 2015. The current usage metrics is available 48-96 hours after online publication and is updated daily on week days.
Initial download of the metrics may take a while.