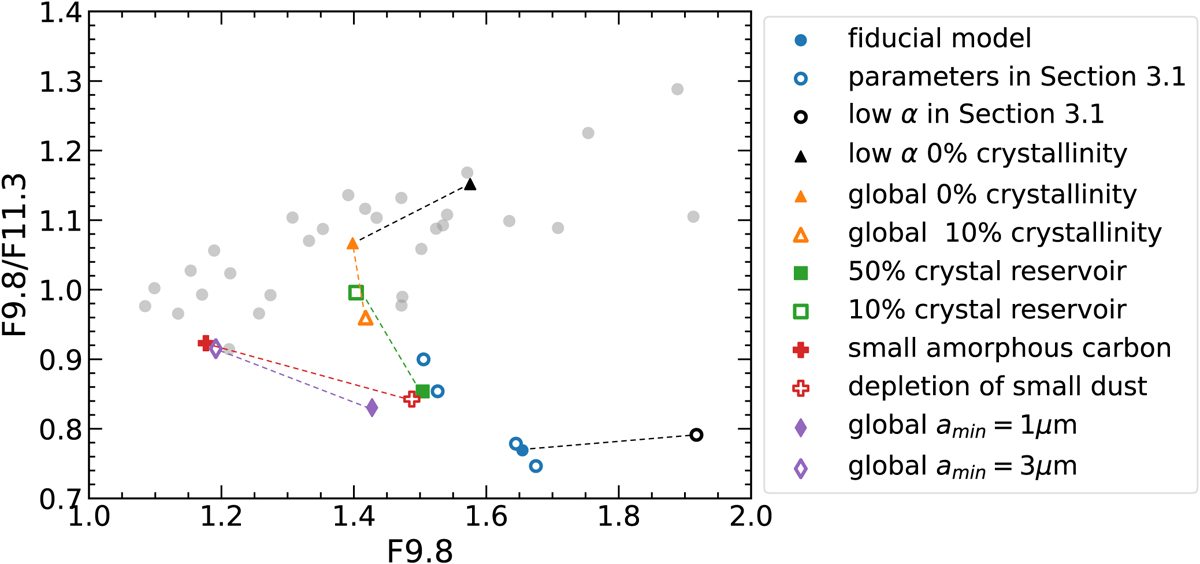
Fig. 11
Download original image
Correlation between the shape of 10 µm features (F9.8/F11.3) and the strength of the amorphous silicate feature at 9.8 µm (F9.8). Gray dots represent Spitzer IRS observations. The fiducial model is marked with a blue dot, and blue circles are the parameter space in Sect. 3.2. The models are summarized in Table 5 and discussed in Sect. 4.2.
Current usage metrics show cumulative count of Article Views (full-text article views including HTML views, PDF and ePub downloads, according to the available data) and Abstracts Views on Vision4Press platform.
Data correspond to usage on the plateform after 2015. The current usage metrics is available 48-96 hours after online publication and is updated daily on week days.
Initial download of the metrics may take a while.