Fig. 8.
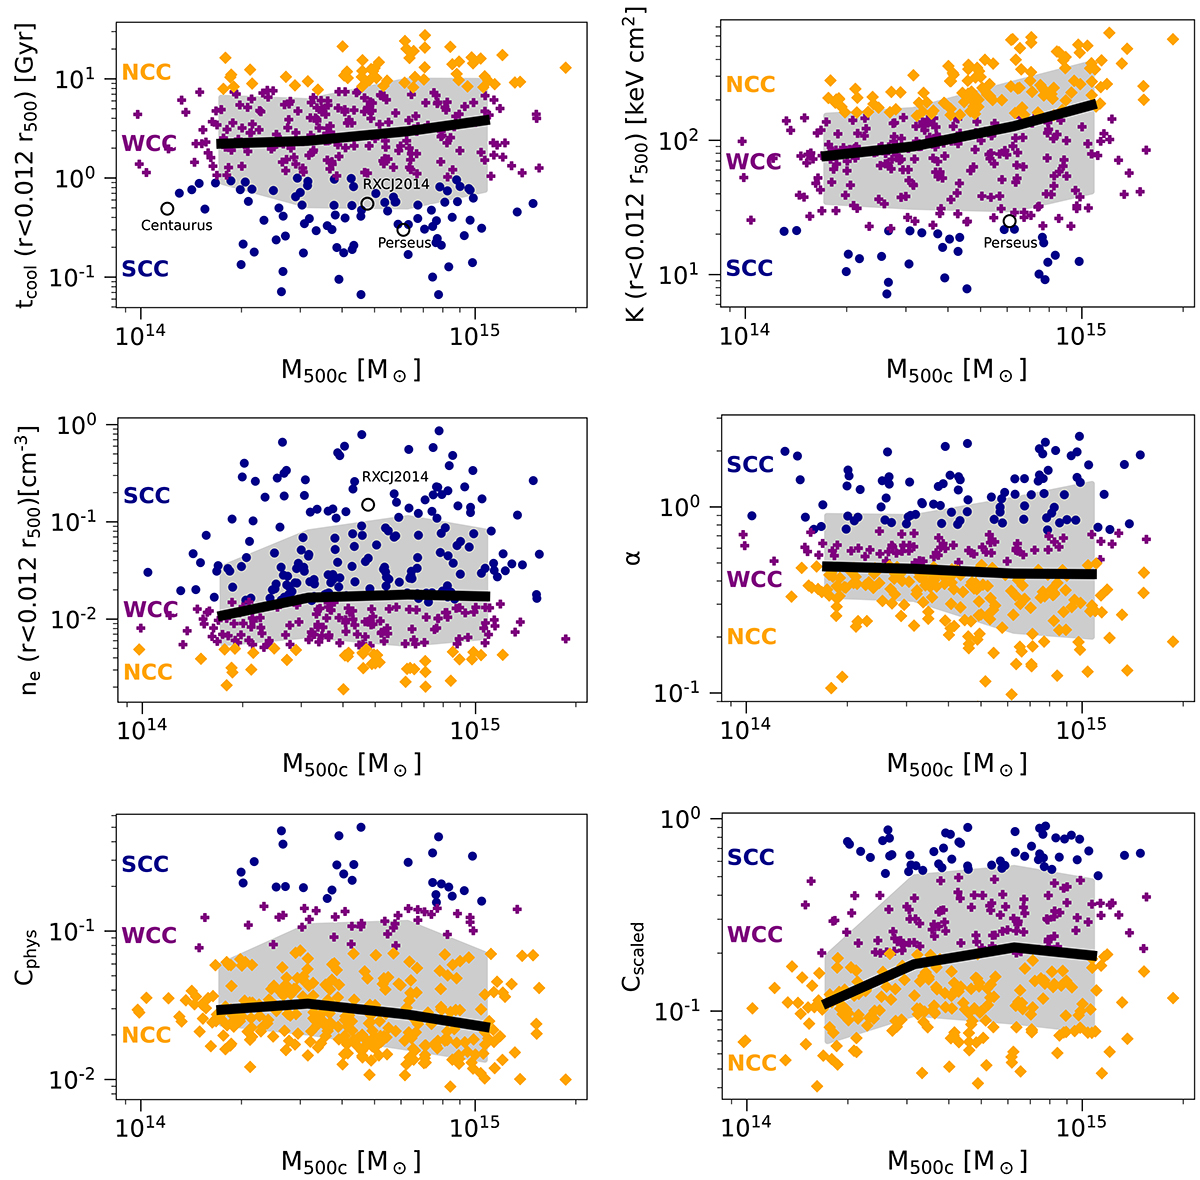
Download original image
Cool core criteria as a function of M500c for the entire TNG-Cluster sample at z = 0. The color of the symbols indicates whether the clusters are classified as SCC (dark blue dots), WCC (purple crosses), or NCC (orange diamonds) according to the quantity on the y-axis. The black line shows the median trend of the CC criteria with M500c. The silver solid region shows the 16 to 84 percentile ranges. From upper left to lower right: central cooling time, central electron number density, central entropy, physical concentration parameter, scaled concentration parameter, and cuspiness parameter. We also made qualitative, face value-only comparisons to values from selected nearby clusters (see text). Overall, there is no well-defined mass trend visible across all CC criteria. In some cases, the central cluster properties do not depend on mass, while other properties show increasing, decreasing, or non-monotonic behavior with halo mass. The number of SCC cluster varies substantially depending on the defining criteria.
Current usage metrics show cumulative count of Article Views (full-text article views including HTML views, PDF and ePub downloads, according to the available data) and Abstracts Views on Vision4Press platform.
Data correspond to usage on the plateform after 2015. The current usage metrics is available 48-96 hours after online publication and is updated daily on week days.
Initial download of the metrics may take a while.