Fig. 5.
Download original image
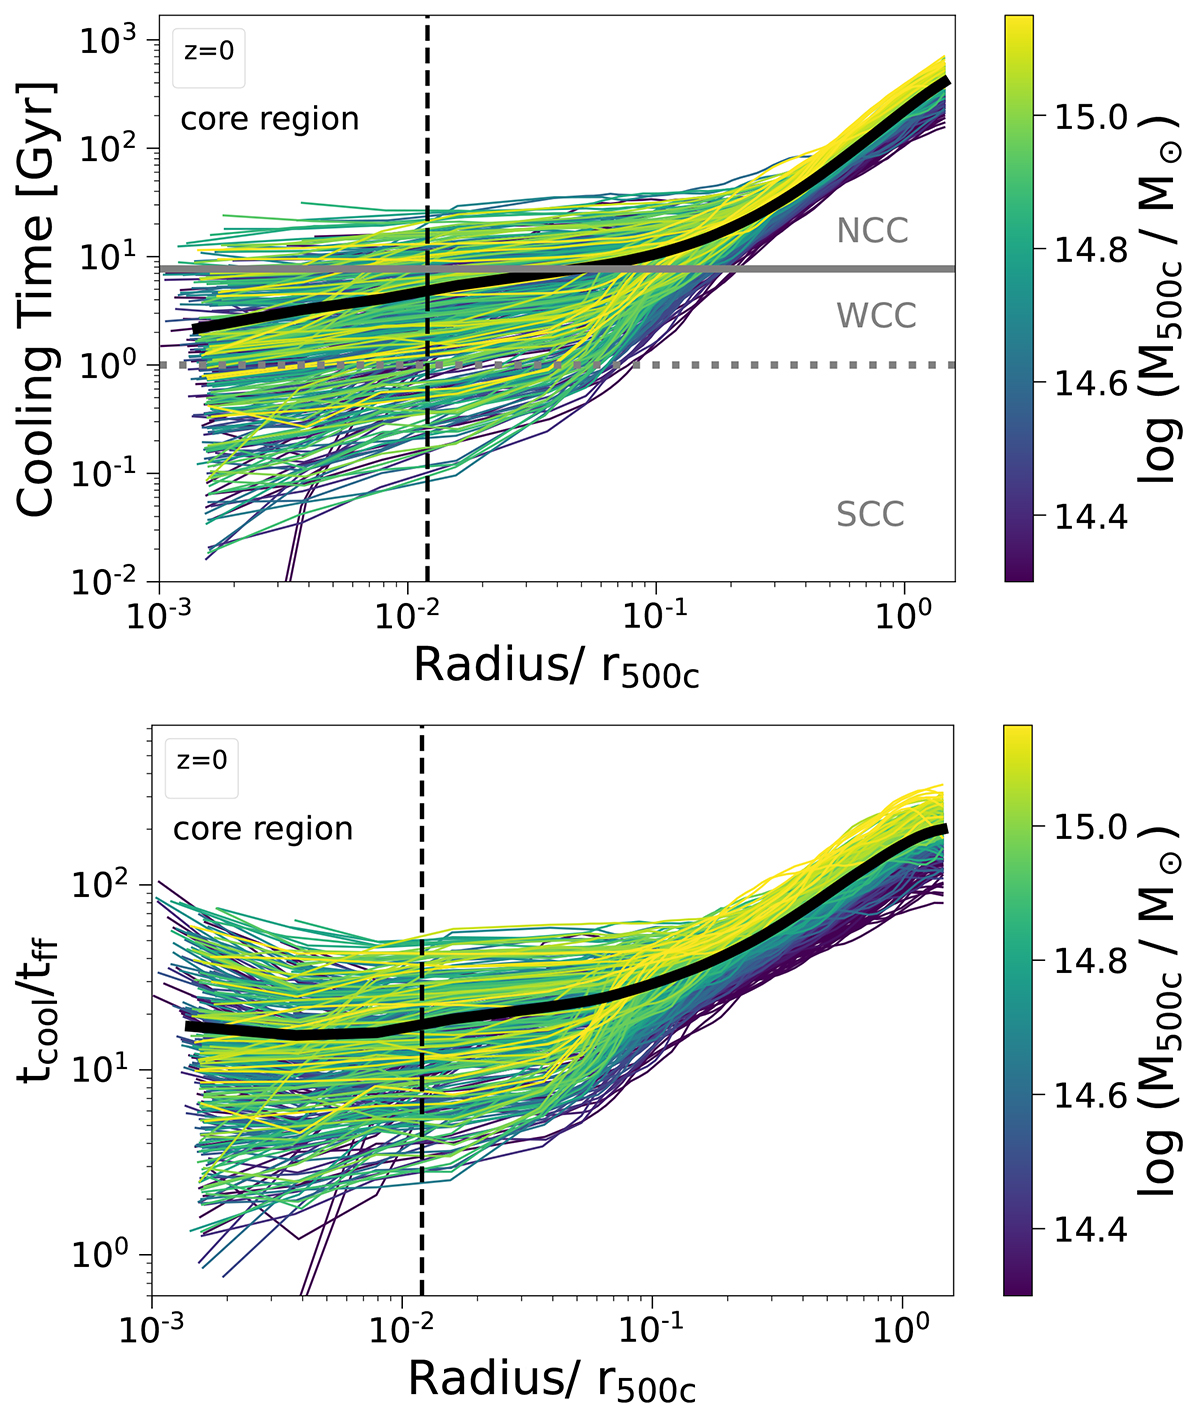
Three-dimensional radial profiles of the cooling time (top) and ratio of cooling time to free-fall time (bottom) for all clusters in the TNG-Cluster sample at z = 0, with a focus on the central regions. The thin curves denote individual clusters and are color coded by M500c. The black curve shows the mean profile across all simulated clusters.
Current usage metrics show cumulative count of Article Views (full-text article views including HTML views, PDF and ePub downloads, according to the available data) and Abstracts Views on Vision4Press platform.
Data correspond to usage on the plateform after 2015. The current usage metrics is available 48-96 hours after online publication and is updated daily on week days.
Initial download of the metrics may take a while.