Open Access
Fig. 3.
Download original image
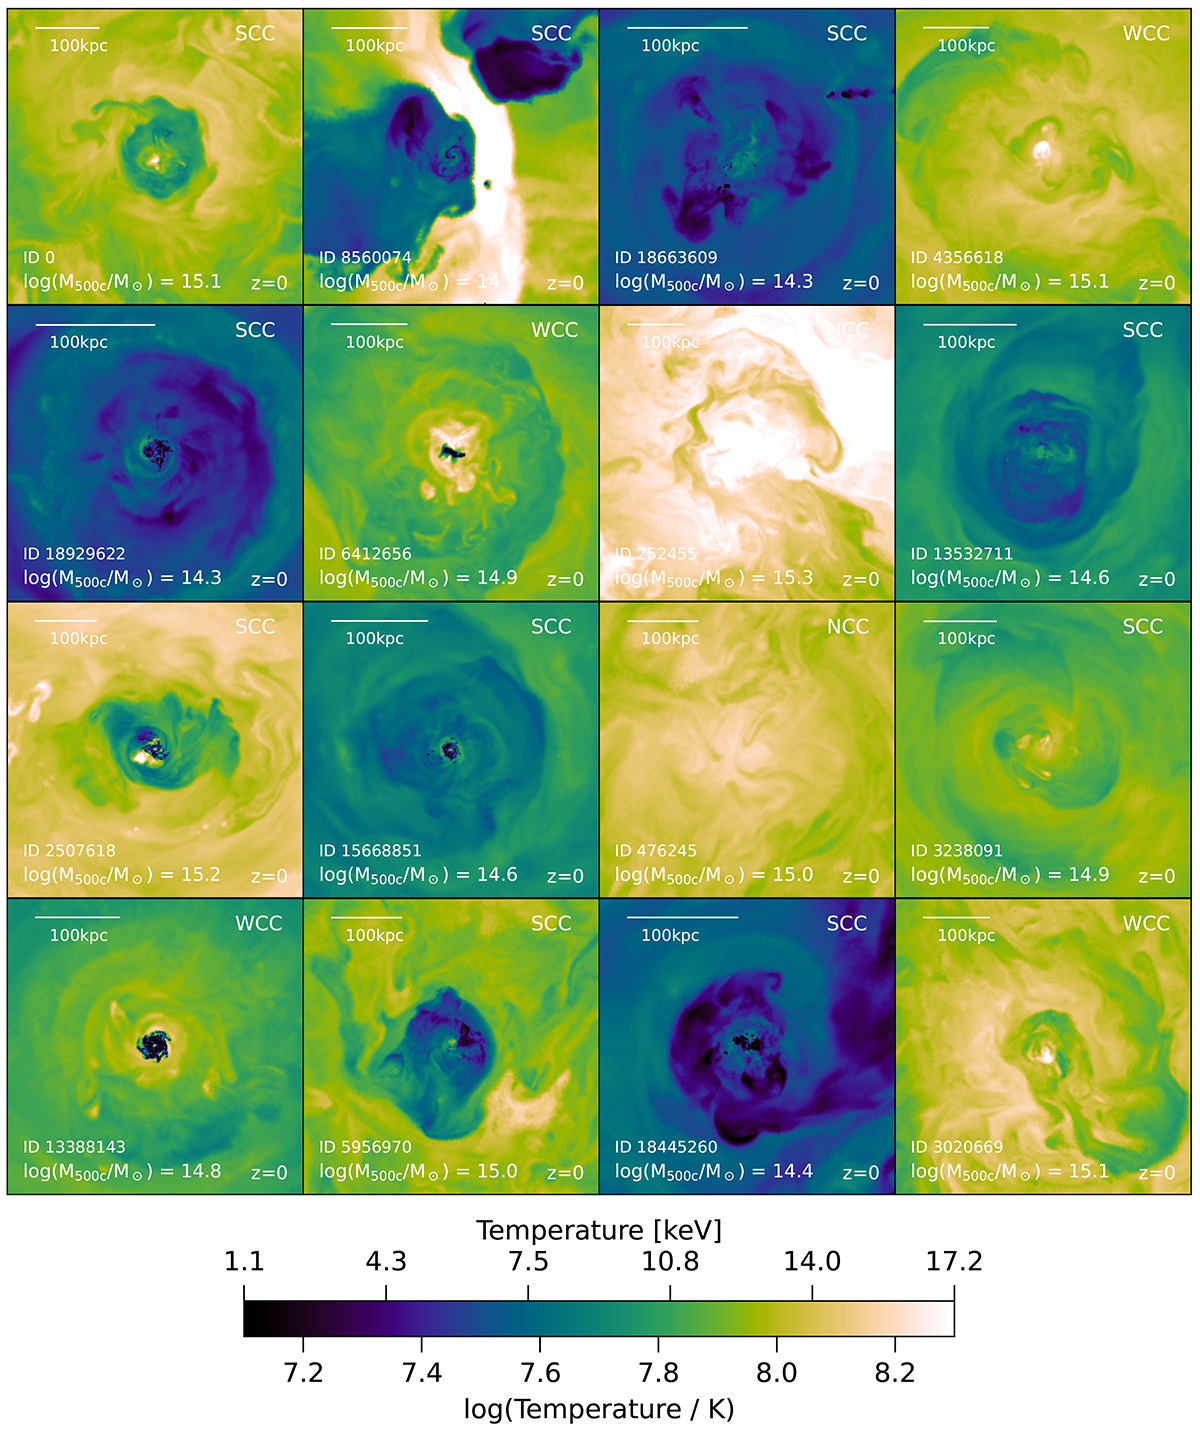
Visualization of the temperature distribution in the core region of the same 16 clusters as in Fig. 1 at z = 0. The distinct cores of some clusters are also visible in the temperature maps. In contrast to the previous figure, the average temperature in the panels depended strongly on the mass of the cluster.
Current usage metrics show cumulative count of Article Views (full-text article views including HTML views, PDF and ePub downloads, according to the available data) and Abstracts Views on Vision4Press platform.
Data correspond to usage on the plateform after 2015. The current usage metrics is available 48-96 hours after online publication and is updated daily on week days.
Initial download of the metrics may take a while.