Fig. B.1.
Download original image
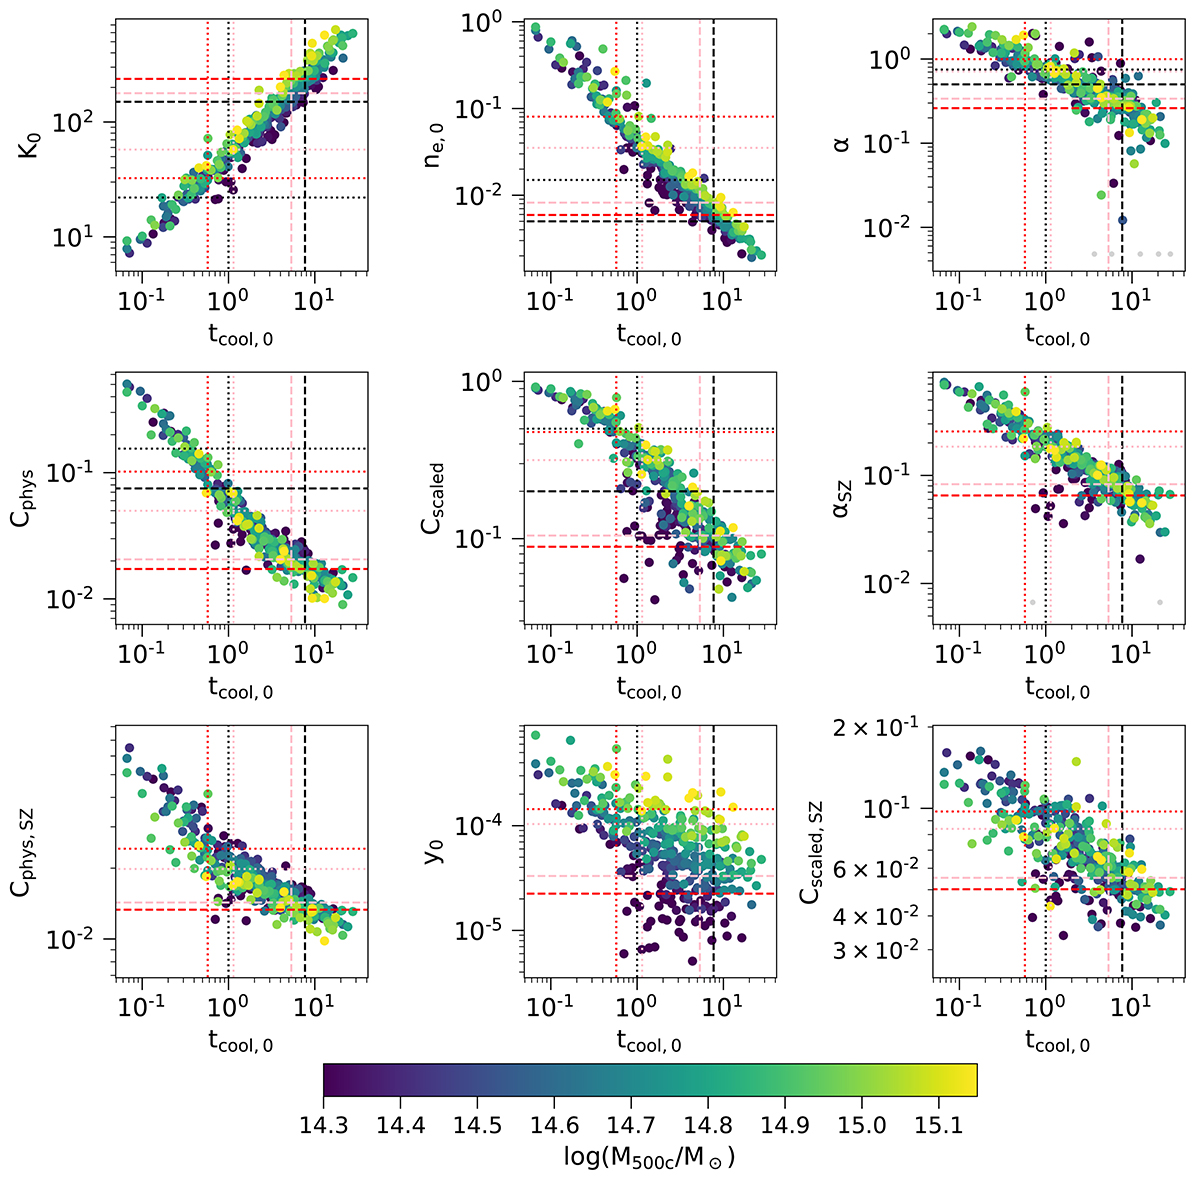
Correlation of ICM properties with the central cooling time for the whole TNG-Cluster sample at z = 0. We show the correlation with the five other properties introduced in Sec. 2.3 and four new properties deduced from the Sunyaev-Zeldovich signal. The mass of each cluster is specified by the color of the dots. Black lines indicate the SCC/WCC thresholds (dotted line) and WCC/NCC thresholds (dashed line) taken from the literature (see Tab. 1). The red lines indicate the 1σ thresholds (column 2 and 3 in Tab. B.1), whereas the pink lines show the thresholds stated in column 4 and 5 of Tab. B.1. (See the text for a motivation of these thresholds.) The gray dots indicate clusters with a negative cuspiness. The five CC metrics considered in this paper as well as the two metrics computed from the SZ signal are well correlated with the central cooling time.
Current usage metrics show cumulative count of Article Views (full-text article views including HTML views, PDF and ePub downloads, according to the available data) and Abstracts Views on Vision4Press platform.
Data correspond to usage on the plateform after 2015. The current usage metrics is available 48-96 hours after online publication and is updated daily on week days.
Initial download of the metrics may take a while.