Open Access
Fig. A.2.
Download original image
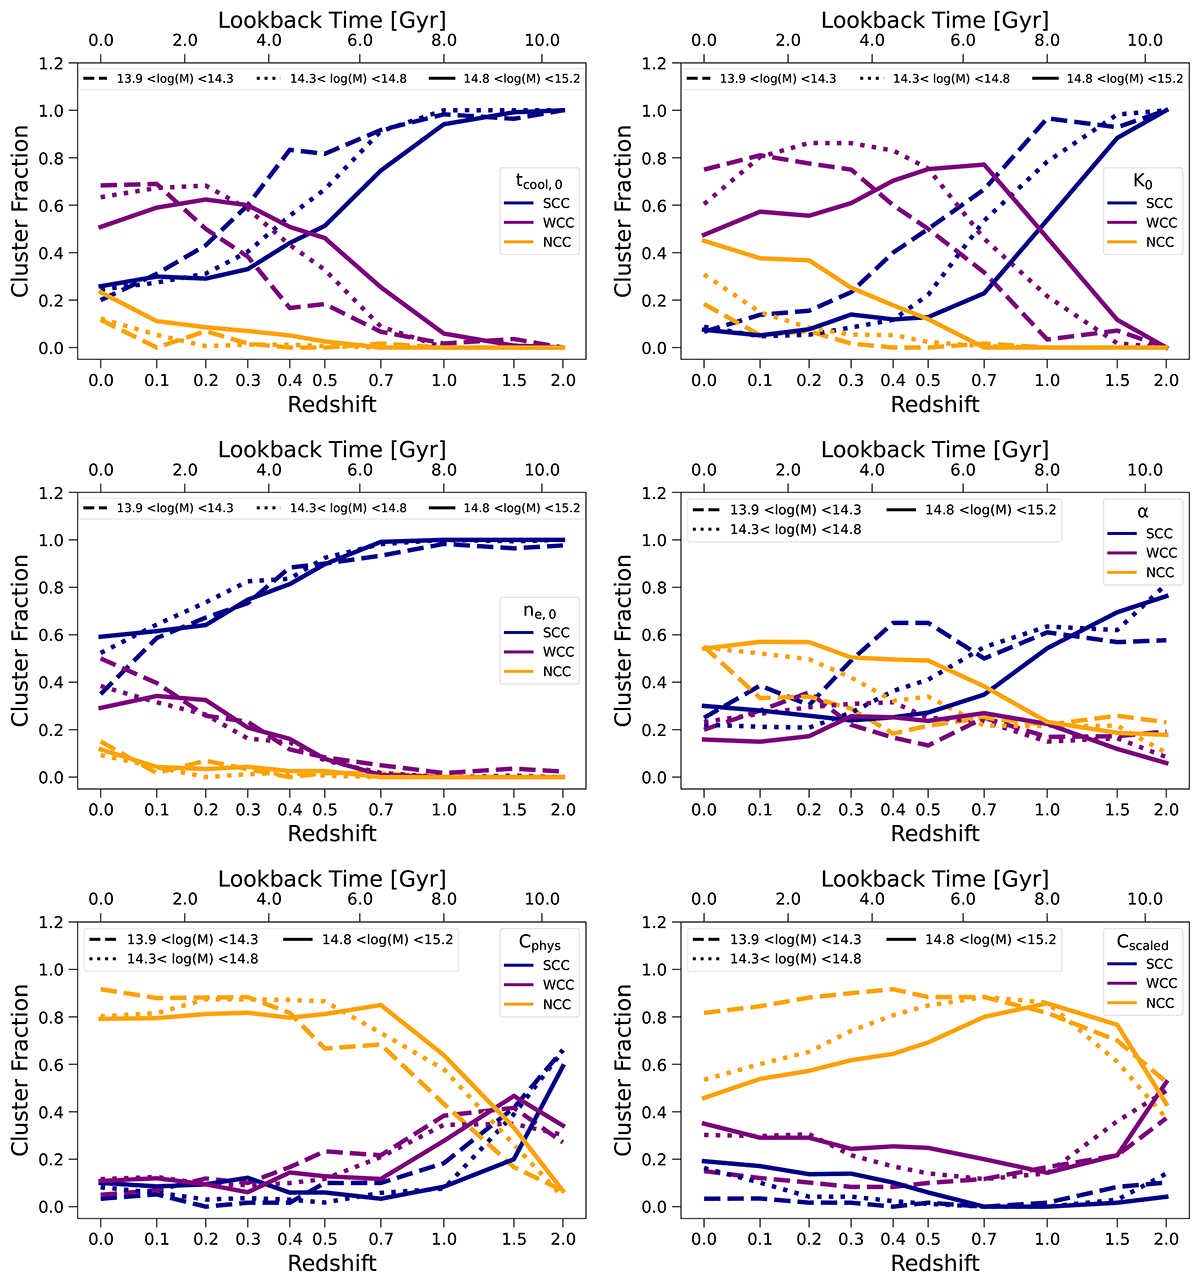
Fraction of SCC, WCC, and NCC clusters as a function of redshift. Analogous to Figure 13, except that here the mass bins are defined at z = 0, and the progenitors in each bin are tracked back to earlier redshifts.
Current usage metrics show cumulative count of Article Views (full-text article views including HTML views, PDF and ePub downloads, according to the available data) and Abstracts Views on Vision4Press platform.
Data correspond to usage on the plateform after 2015. The current usage metrics is available 48-96 hours after online publication and is updated daily on week days.
Initial download of the metrics may take a while.