Fig. 14.
Download original image
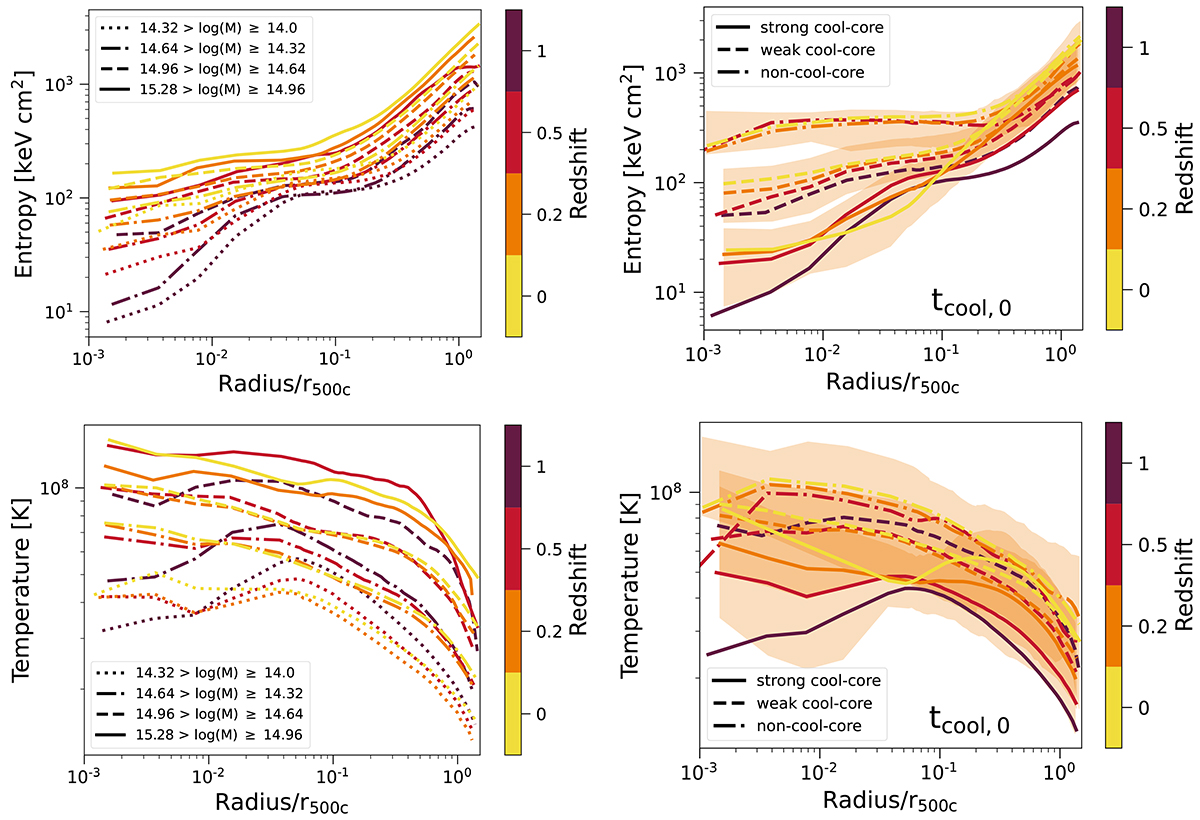
Redshift evolution of cluster entropy (top) and temperature (bottom) profiles. The left panels stack the full TNG-Cluster sample based on four halo mass bins (log10(M/M500c) ranges in legends), while the right panels separate the full sample into its SCC, WCC, and NCC sub-populations. In both cases, we bin in mass or classify CC state at each of z = 0, z = 0.2, z = 0.5, and z = 1 separately. The entropy profiles shift downward with increasing redshift and decreasing halo mass while maintaining a similar shape. The temperature profiles strongly depend on mass and weakly on the redshift. At all redshifts, the entropy profiles for CCs and NCCs are well separated in the core, while the temperature profiles are not and show a large scatter.
Current usage metrics show cumulative count of Article Views (full-text article views including HTML views, PDF and ePub downloads, according to the available data) and Abstracts Views on Vision4Press platform.
Data correspond to usage on the plateform after 2015. The current usage metrics is available 48-96 hours after online publication and is updated daily on week days.
Initial download of the metrics may take a while.