Fig. 13.
Download original image
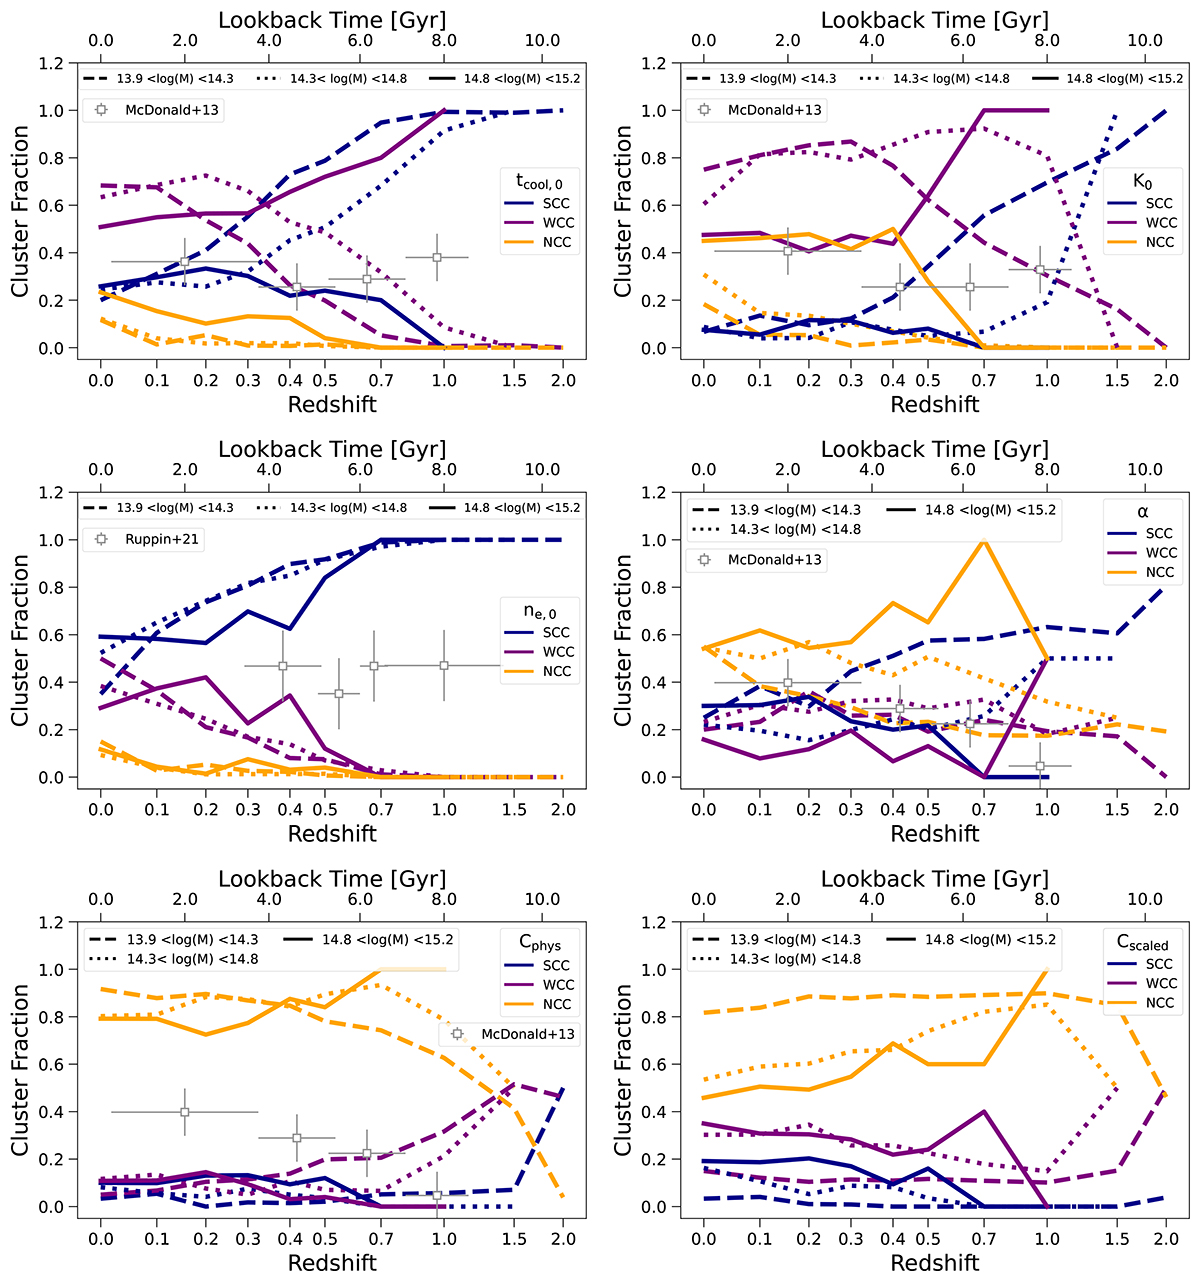
Fraction of SCC (blue), WCC (purple), and NCC (orange) clusters in the TNG-Cluster simulation as a function of redshift. We separated clusters into low-mass (dashed lines), intermediate-mass (dotted lines), and high-mass bins (solid lines). The log10(M/M500c) thresholds for each mass bin are stated in the legend. We overplot the results for the SCC fraction from observations (McDonald et al. 2013; Ruppin et al. 2021) in five of the six panels. For 0 < z ≤ 0.7, the observations should be compared to the high-mass bin (solid line) and at z ∼ 1 to the intermediate-mass bin (dotted line). The comparisons are meant to be qualitative (i.e., at face value only). The six panels show the classification based on our six fiducial CC criteria, from top left to bottom right: cooling time, entropy, density, cuspiness, and the two X-ray concentration measures. Overall, the fraction of SCC clusters is higher at earlier times, and NCC clusters appear only at z ≲ 0.5, although redshift trends depend on the adopted CC criterion.
Current usage metrics show cumulative count of Article Views (full-text article views including HTML views, PDF and ePub downloads, according to the available data) and Abstracts Views on Vision4Press platform.
Data correspond to usage on the plateform after 2015. The current usage metrics is available 48-96 hours after online publication and is updated daily on week days.
Initial download of the metrics may take a while.