Fig. 12.
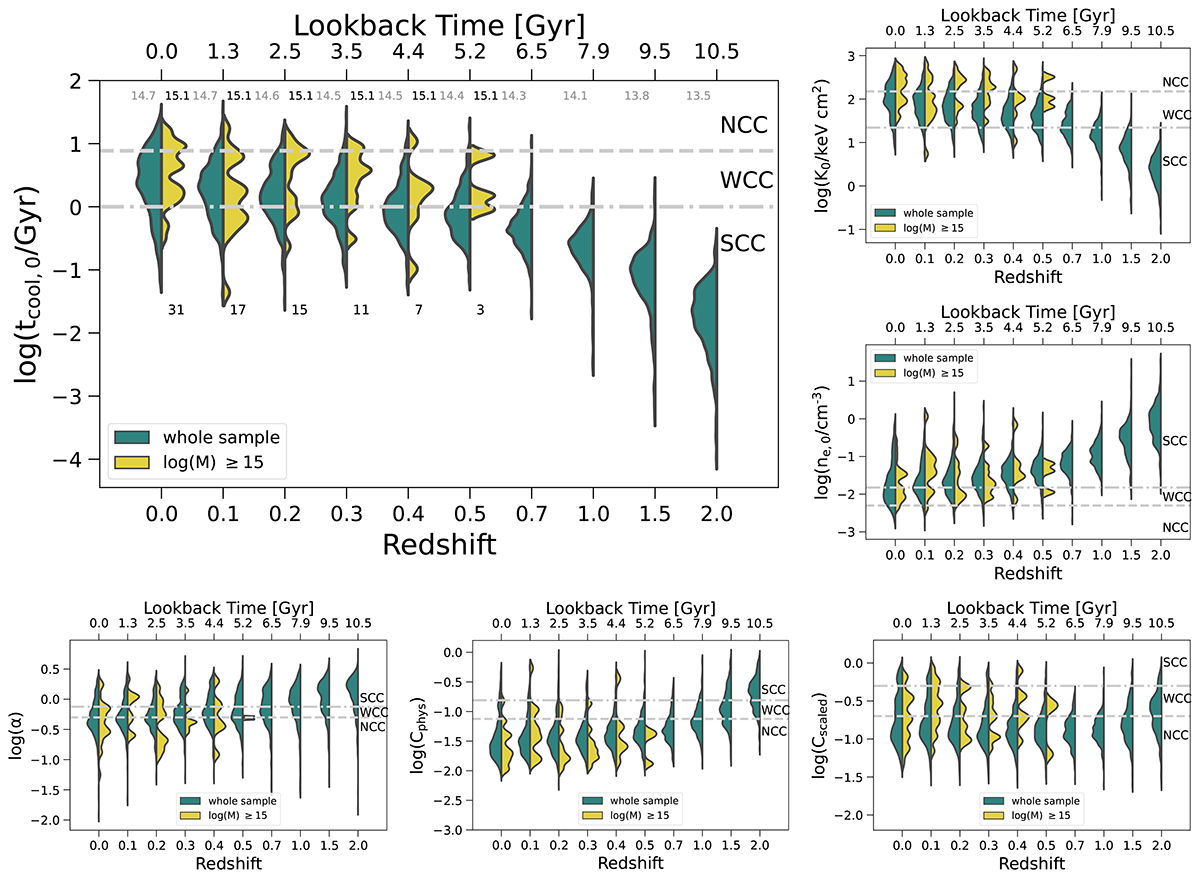
Download original image
Redshift evolution of the six central properties used to classify (N)CC clusters from z = 0 to z = 2. These properties are, clockwise from the upper left, cooling time, entropy, electron number density, scaled X-ray concentration, physical X-ray concentration, and cuspiness. Each panel includes two sets of violins: the left (teal) shows the distributions for the entire TNG-Cluster sample, while the right (yellow) shows only the high-mass halos with M500c > 1015 M⊙. In this latter case, we probe the evolution at an approximately fixed halo mass, and the number in each bin is indicated. The horizontal gray lines mark the thresholds between NCC, WCC, and SCC clusters. The strong redshift evolution is due both to the evolving mass distribution of the sample, with lower-mass clusters at earlier times, as well as the physical evolution in central gas properties.
Current usage metrics show cumulative count of Article Views (full-text article views including HTML views, PDF and ePub downloads, according to the available data) and Abstracts Views on Vision4Press platform.
Data correspond to usage on the plateform after 2015. The current usage metrics is available 48-96 hours after online publication and is updated daily on week days.
Initial download of the metrics may take a while.