Fig. 11.
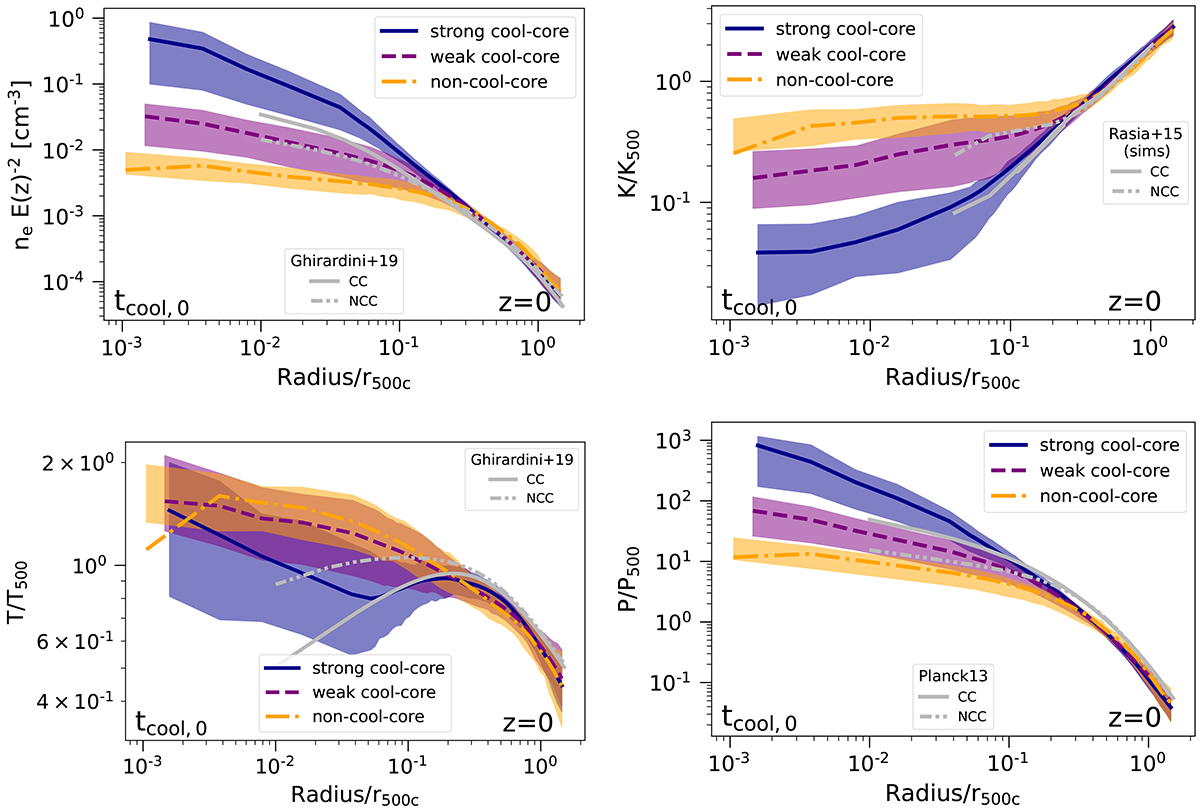
Download original image
Median profiles of four physical properties for SCC (dark blue, solid line), WCC (purple, dashed line), and NCC (orange, dashed dotted line) clusters for TNG-Cluster at z = 0. From upper left to lower right the panels show electron number density, entropy, temperature, and pressure. The filled regions show the 16−84 percentile band of the separate populations. The distinction in core states was made with our fiducial central cooling time definition. We made a comparison to observations by Ghirardini et al. (2019, electron number density and temperature), by the Planck Collaboration Int. V (2013, pressure), and to simulations by Rasia et al. (2015, entropy). In general, the profiles for different populations are clearly separated and are offset in normalization while maintaining a similar shape.
Current usage metrics show cumulative count of Article Views (full-text article views including HTML views, PDF and ePub downloads, according to the available data) and Abstracts Views on Vision4Press platform.
Data correspond to usage on the plateform after 2015. The current usage metrics is available 48-96 hours after online publication and is updated daily on week days.
Initial download of the metrics may take a while.