Fig. 10.

Download original image
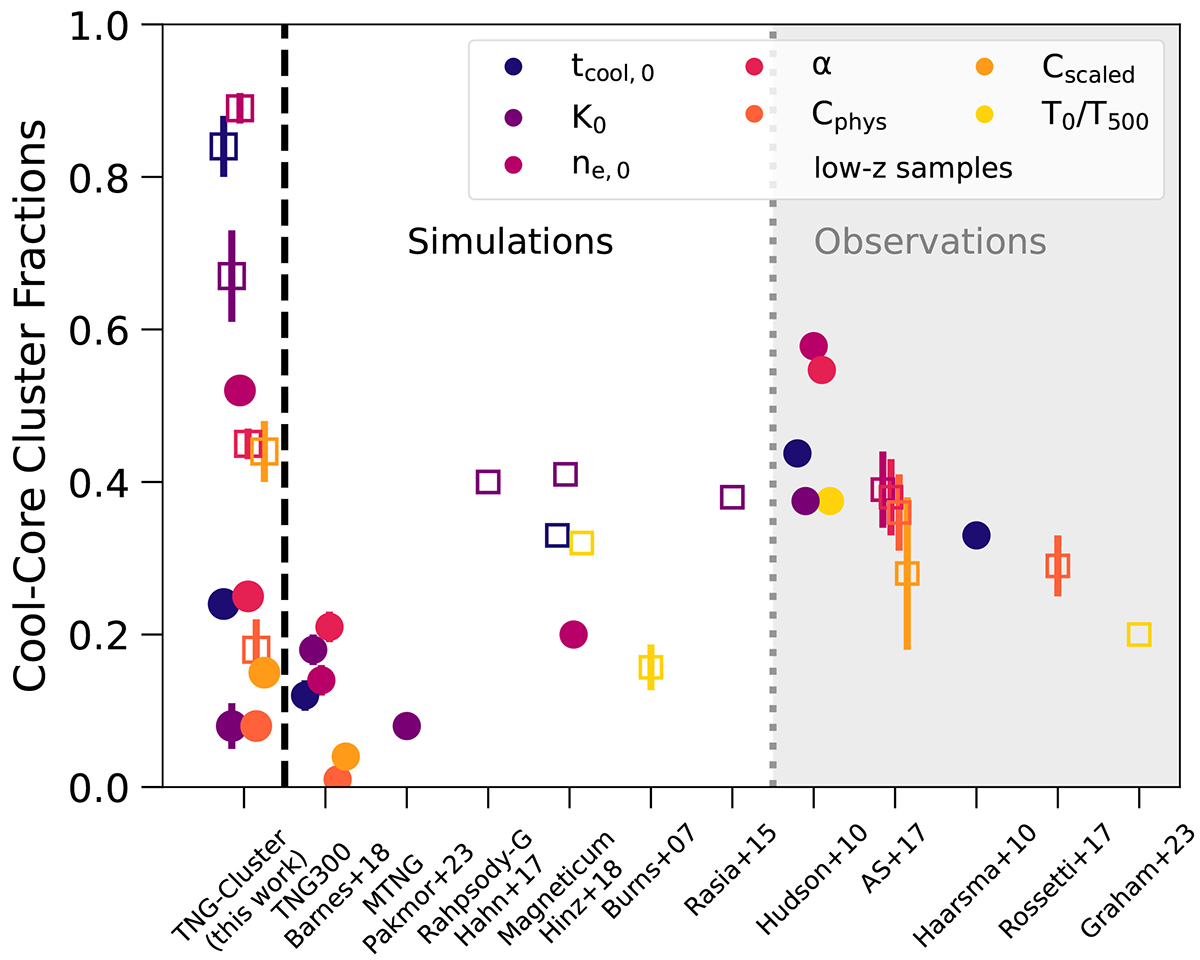
Cool-core fractions of clusters in TNG-Cluster (left), other simulations (center), and observations (right). Each are based on a given central thermodynamical property, as shown in the legend and color. Circles indicate SCCs, while squares show CCs. We note that we defined the number of CCs as SCCs+WCCs for this work. Even when using the same central property, the various works differ in many other aspects: the exact definitions used to classify the CC state, sample properties (i.e., mean cluster mass and mass distribution), and the cluster redshift distribution. As a result, the comparison among simulations and between simulations as well as the various observations require careful evaluation (see text) and are meant to be qualitative (at face value only) in this figure.
Current usage metrics show cumulative count of Article Views (full-text article views including HTML views, PDF and ePub downloads, according to the available data) and Abstracts Views on Vision4Press platform.
Data correspond to usage on the plateform after 2015. The current usage metrics is available 48-96 hours after online publication and is updated daily on week days.
Initial download of the metrics may take a while.


