Fig. 1.
Download original image
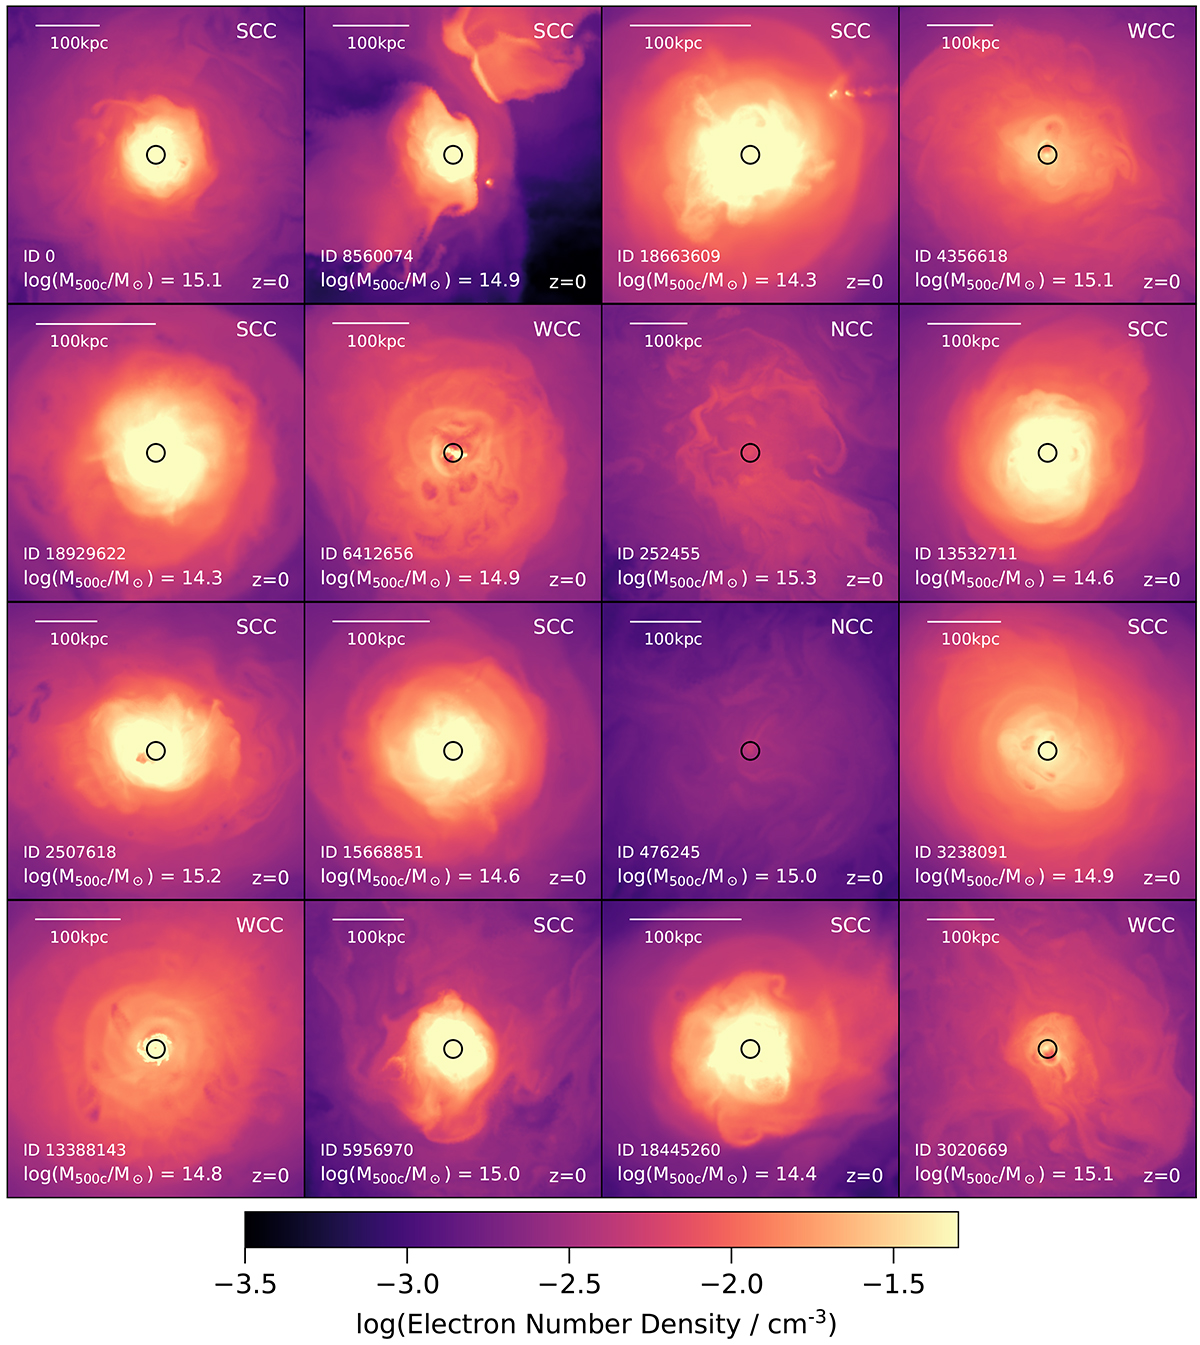
Visualization of the electron number density in the core region of 16 clusters of TNG-Cluster at z = 0. Each panel shows the central 20% of r500c projected along a line of sight of 15 kpc. The halo mass M500c of each cluster is indicated in the panels. In the upper right of each panel, we also label the core state of each cluster based on the central cooling time. The aperture of 0.012 r500c used to compute the central cooling time is depicted by black circles in the maps (see text). The clusters were chosen to reflect the diversity of the simulated cluster masses and to show the wide range of different morphologies of the gas.
Current usage metrics show cumulative count of Article Views (full-text article views including HTML views, PDF and ePub downloads, according to the available data) and Abstracts Views on Vision4Press platform.
Data correspond to usage on the plateform after 2015. The current usage metrics is available 48-96 hours after online publication and is updated daily on week days.
Initial download of the metrics may take a while.