Fig. 17
Download original image
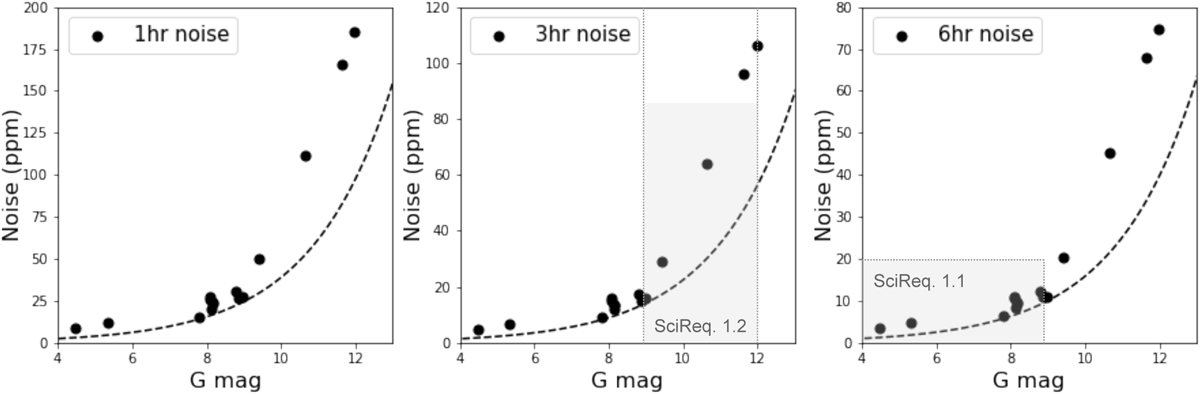
Measured photometric precision as a function of the stellar Gaia magnitude and integration time. The dashed curve represents the photon noise. Results obtained with PyCHEOPS (v1. 0. 0) for light curves extracted using DRP v13 with the default photometric aperture of r = 25 px. The noise is estimated using the minimum error method in all the cases (following Maxted et al. 2022a, this is a conservative estimation). The grey region highlights the expected performance for bright stars (SciReq. 1.1) and faint stars (SciReq. 1.2).
Current usage metrics show cumulative count of Article Views (full-text article views including HTML views, PDF and ePub downloads, according to the available data) and Abstracts Views on Vision4Press platform.
Data correspond to usage on the plateform after 2015. The current usage metrics is available 48-96 hours after online publication and is updated daily on week days.
Initial download of the metrics may take a while.