Fig. 4
Download original image
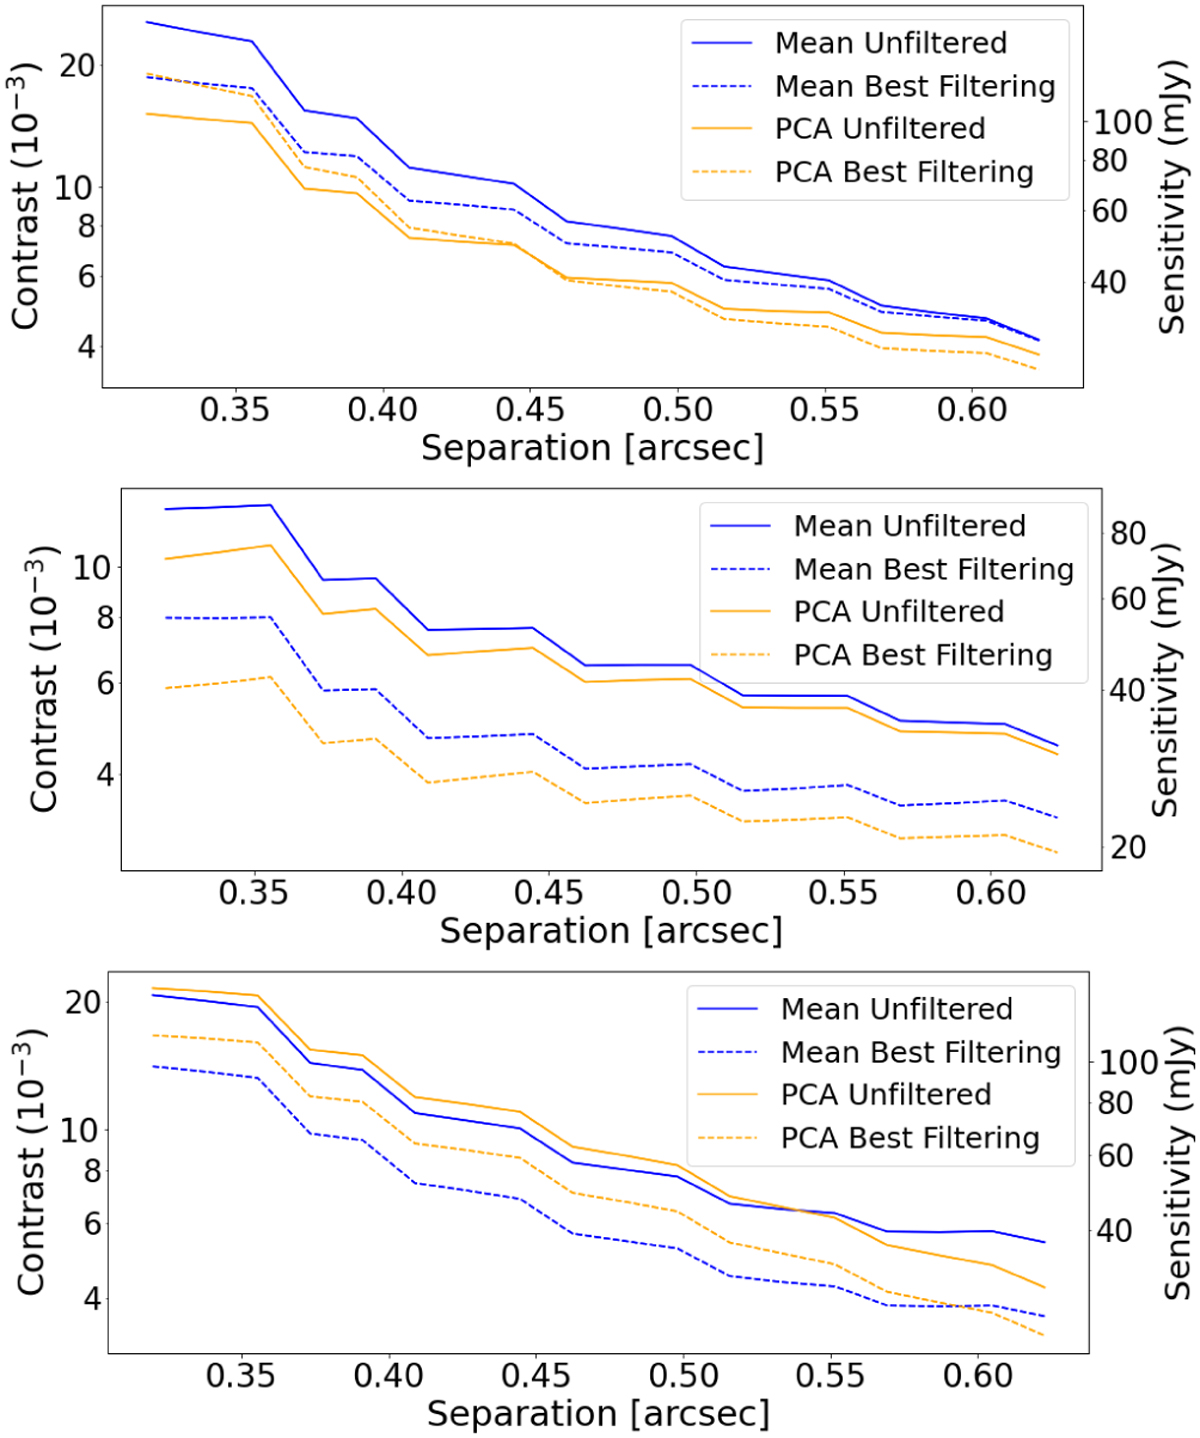
Contrast curves obtained with ADI (top panel), RDI (middle panel) and without PSF subtraction (bottom panel) without (straight lines) and with optimal filtering (dashed lines) for mean background subtraction (blue) and PCA background subtraction (orange). A pre-subtraction with mean has been applied on the PCA background subtracted cube before we applied the 9-pixel mask on the star.
Current usage metrics show cumulative count of Article Views (full-text article views including HTML views, PDF and ePub downloads, according to the available data) and Abstracts Views on Vision4Press platform.
Data correspond to usage on the plateform after 2015. The current usage metrics is available 48-96 hours after online publication and is updated daily on week days.
Initial download of the metrics may take a while.