Fig. 9
Download original image
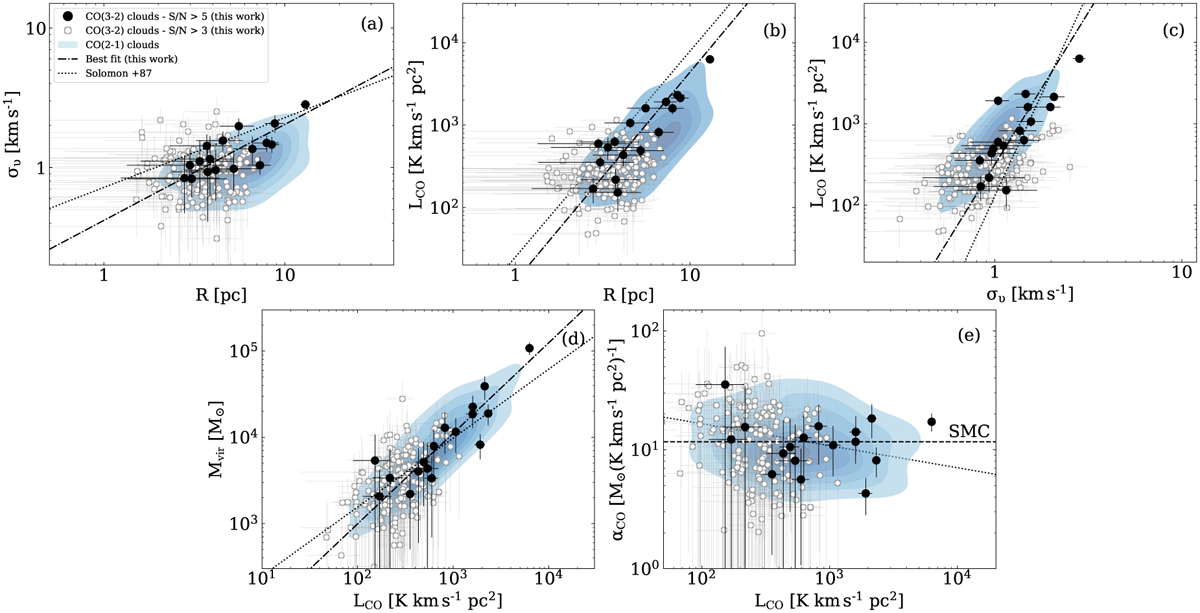
Scaling relations of the CO(3–2) clouds parameters in the SMC. Panel a: size and linewidth relation (σv – R). Panel b: luminosity–size relation (R – LCO). Panel c: Luminosity and linewidth relation (σv – LCO). Panel d: Luminosity-virial mass relation (LCO – Mvir). Panel e: CO-to-H2 conversion factor-luminosity relation (αCO–LCO). Black dots correspond to clouds with S/N ≳ 5, while the gray dots correspond to clouds with S/N between 3 and 5. For comparison, we plot the distribution of the CO(2–1) clouds in a blue color palette scale showing the concentration of the CO(2–1) clouds (Saldaño et al. 2023). In all the panels, the best fit for the brightest CO(3–2) clouds are indicated by dot-dashed lines. The Solomon et al. (1987) relation is indicated by dotted lines. Panel e: Dashed horizontal line indicates the median αCO(3-2) of ![]() M⊙ (K km s−1 pc2)−1.
M⊙ (K km s−1 pc2)−1.
Current usage metrics show cumulative count of Article Views (full-text article views including HTML views, PDF and ePub downloads, according to the available data) and Abstracts Views on Vision4Press platform.
Data correspond to usage on the plateform after 2015. The current usage metrics is available 48-96 hours after online publication and is updated daily on week days.
Initial download of the metrics may take a while.