Fig. 8
Download original image
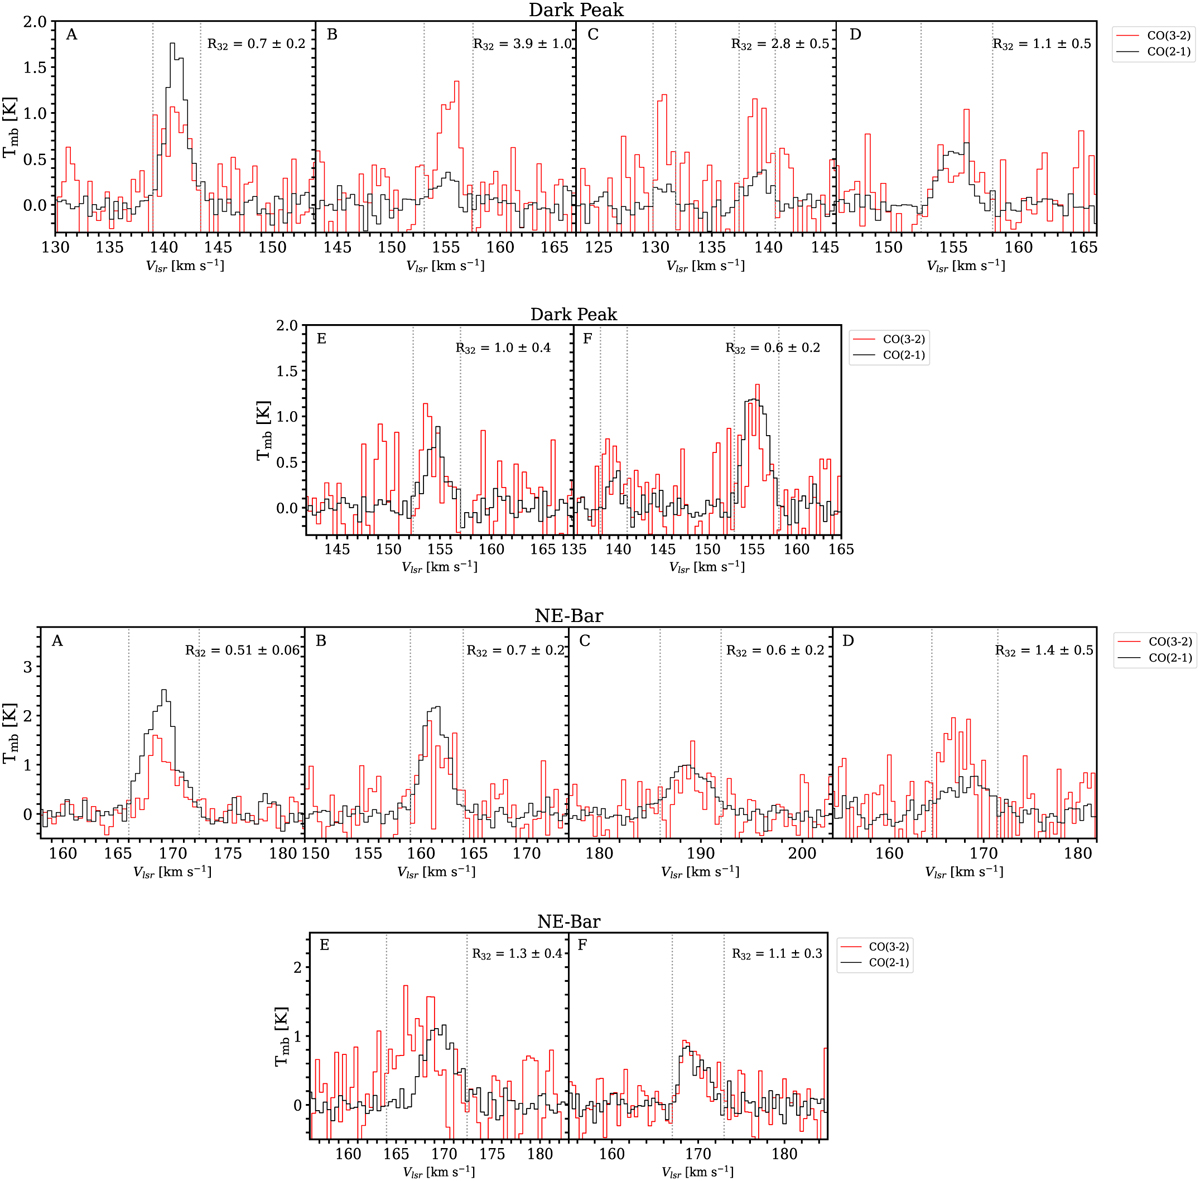
CO(3–2) and CO(2–1) spectral lines toward DarkPK and NE bar. The CO(3–2) spectra are shown in red and the CO(2–1) spectra are in black. The CO spectral lines were extracted at the positions A, B, C, D, E, and F in the DarkPK and NE bar shown by crosses in Figs. 3 and 4, respectively. The integrated CO emission in both transitions was determined using the zeroth-moment within the velocity range shown in the vertical dotted lines. The derived ratio, R32, is shown in the right upper corner of each panel.
Current usage metrics show cumulative count of Article Views (full-text article views including HTML views, PDF and ePub downloads, according to the available data) and Abstracts Views on Vision4Press platform.
Data correspond to usage on the plateform after 2015. The current usage metrics is available 48-96 hours after online publication and is updated daily on week days.
Initial download of the metrics may take a while.