Fig. 5
Download original image
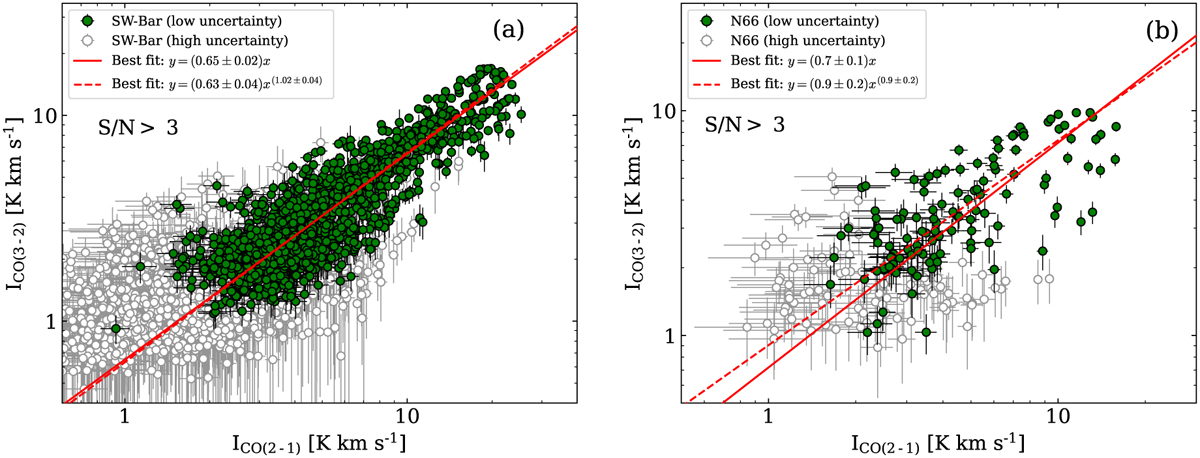
Relationship between ICO(3-2) and ICO(2-1) for the SW bar and N66. The integrated emission in both transitions has S/N > 3. The green dots (indicated as low uncertainty) correspond to integrated emission with relative uncertainties <20% in both transitions. The white dots indicate integrated emissions with higher relative uncertainties. The solid and dashed red lines show the best fits of the low uncertainty data assuming a linear and a power-law model, respectively.
Current usage metrics show cumulative count of Article Views (full-text article views including HTML views, PDF and ePub downloads, according to the available data) and Abstracts Views on Vision4Press platform.
Data correspond to usage on the plateform after 2015. The current usage metrics is available 48-96 hours after online publication and is updated daily on week days.
Initial download of the metrics may take a while.