Fig. 3
Download original image
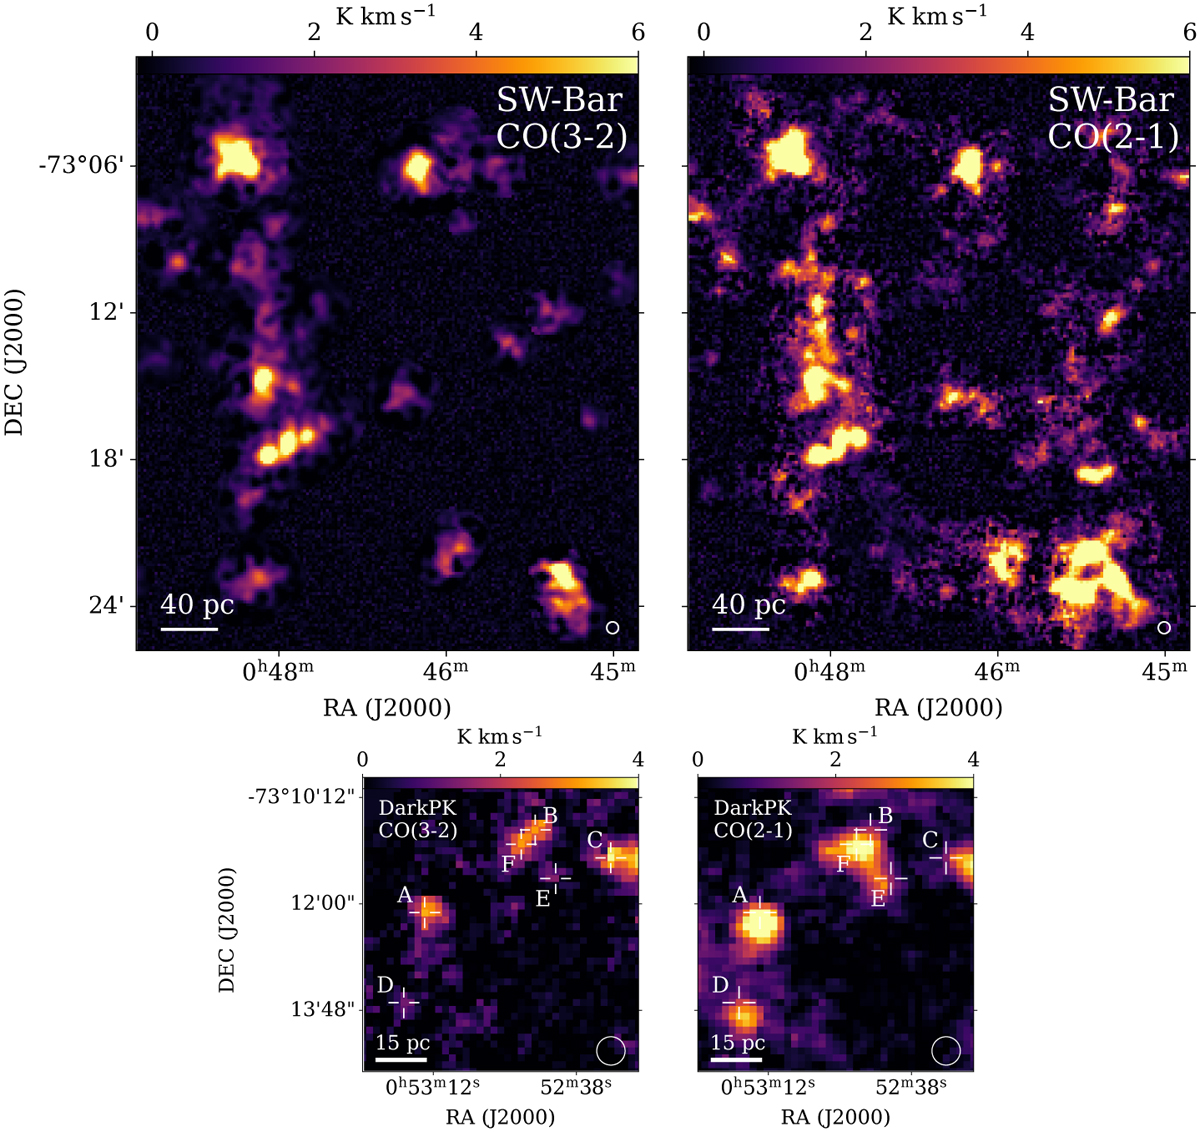
Integrated CO emission in the SW bar and DarkPK. All maps were obtained with the moment-masked method. The left panels correspond to the transition J = 3–2, while the right panels show the CO emission in the transition J = 2–1. The spatial resolution of 30″ is indicated in the bottom right corner of all maps. The upper panels show the SW bar CO(3–2) and CO(2–1) map used to determine the ratio represented by R32 pixel-by-pixel. The lower panels show the DarkPK maps with white crosses indicating six positions (A, B, C, D, E, and F), where the CO(3–2) and CO(2–1) spectra were extracted to calculate R32. A color-scaling bar is shown in the top of each map.
Current usage metrics show cumulative count of Article Views (full-text article views including HTML views, PDF and ePub downloads, according to the available data) and Abstracts Views on Vision4Press platform.
Data correspond to usage on the plateform after 2015. The current usage metrics is available 48-96 hours after online publication and is updated daily on week days.
Initial download of the metrics may take a while.