Open Access
Fig. 2
Download original image
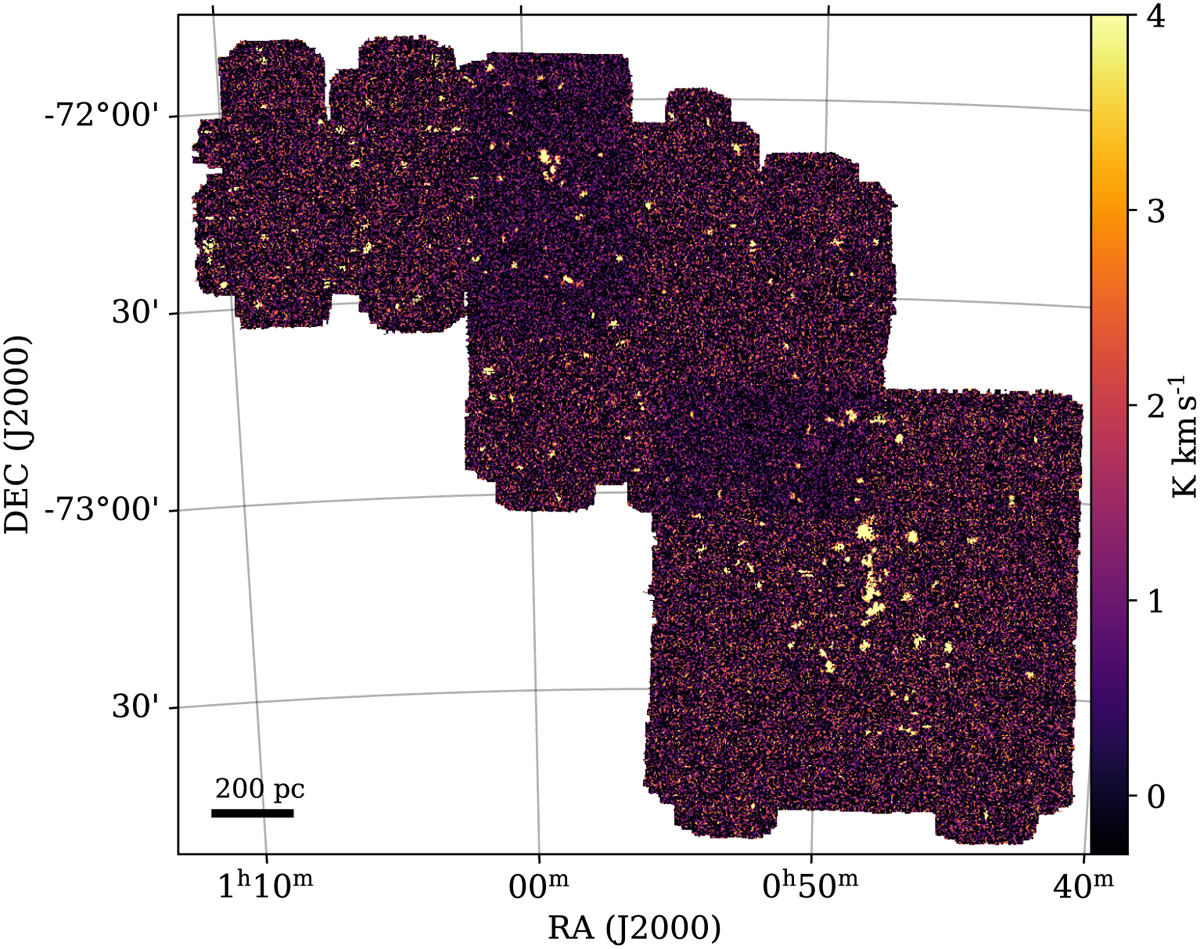
CO(3–2) integrated map of the SMC bar observed by SuperCAM. The integration was done within the velocity range of clouds with high S/N ratios (>3). We included an artificial homogeneous background noise in the map to enhance the appearance of the detected clouds. The background noise is shown in Fig. A.1.
Current usage metrics show cumulative count of Article Views (full-text article views including HTML views, PDF and ePub downloads, according to the available data) and Abstracts Views on Vision4Press platform.
Data correspond to usage on the plateform after 2015. The current usage metrics is available 48-96 hours after online publication and is updated daily on week days.
Initial download of the metrics may take a while.