Fig. B.1
Download original image
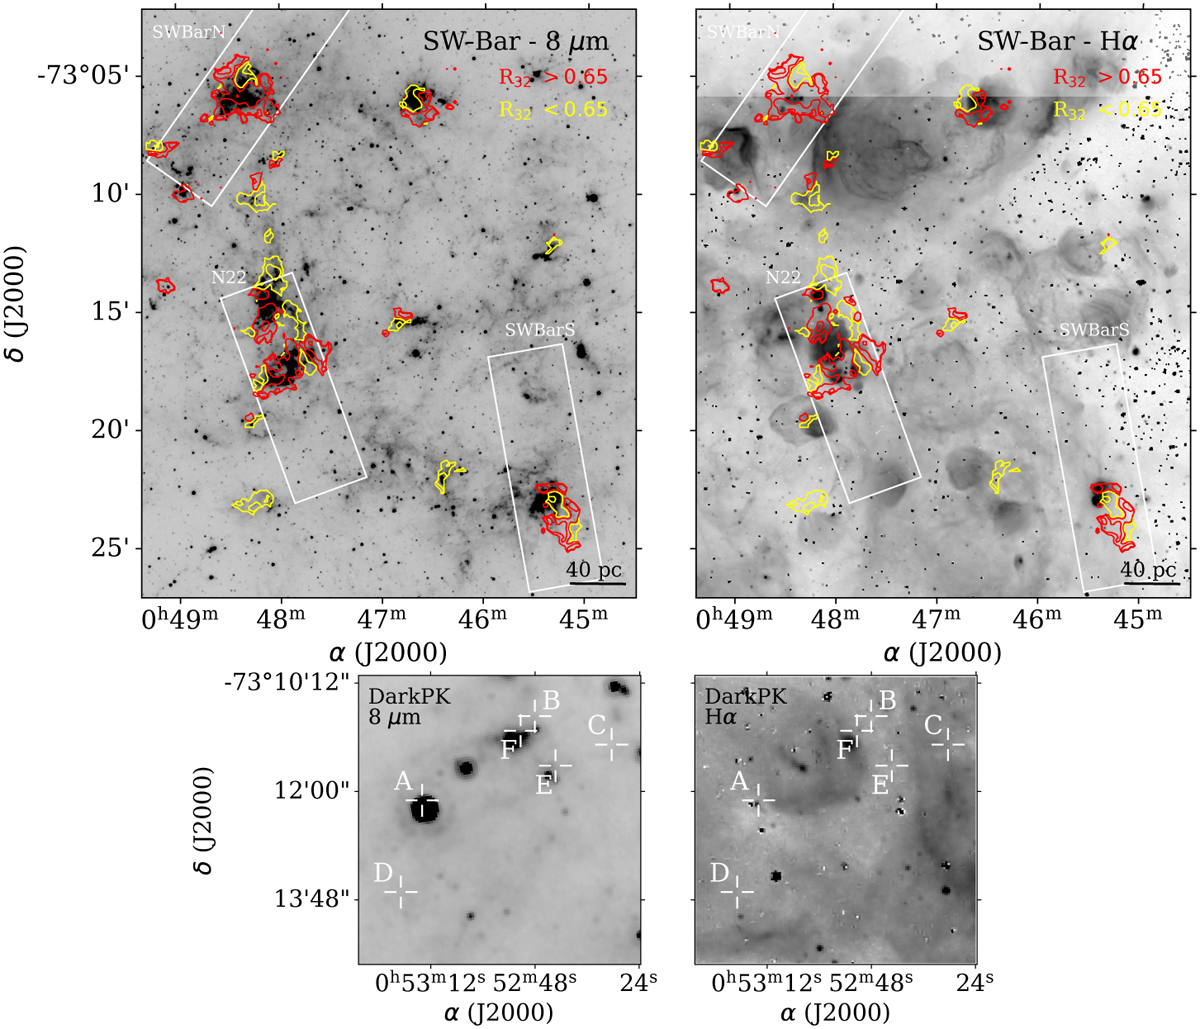
Spatial distribution of R32 (colored contours) overlapping on the Spitzer 8 µm (left panels) and Hα emission (right panels) in grayscale for the SW-BAR and DarkPK regions. The yellow and red contours on the top panels correspond to R32 = 0.2, 0.4, 0.6 and 0.7, 1.0, 2.0, respectively. In the bottom panels, the crosses A, B, C, D, E, and F, indicate the position where R32 was estimated (see Fig. 8).
Current usage metrics show cumulative count of Article Views (full-text article views including HTML views, PDF and ePub downloads, according to the available data) and Abstracts Views on Vision4Press platform.
Data correspond to usage on the plateform after 2015. The current usage metrics is available 48-96 hours after online publication and is updated daily on week days.
Initial download of the metrics may take a while.