Fig. 10
Download original image
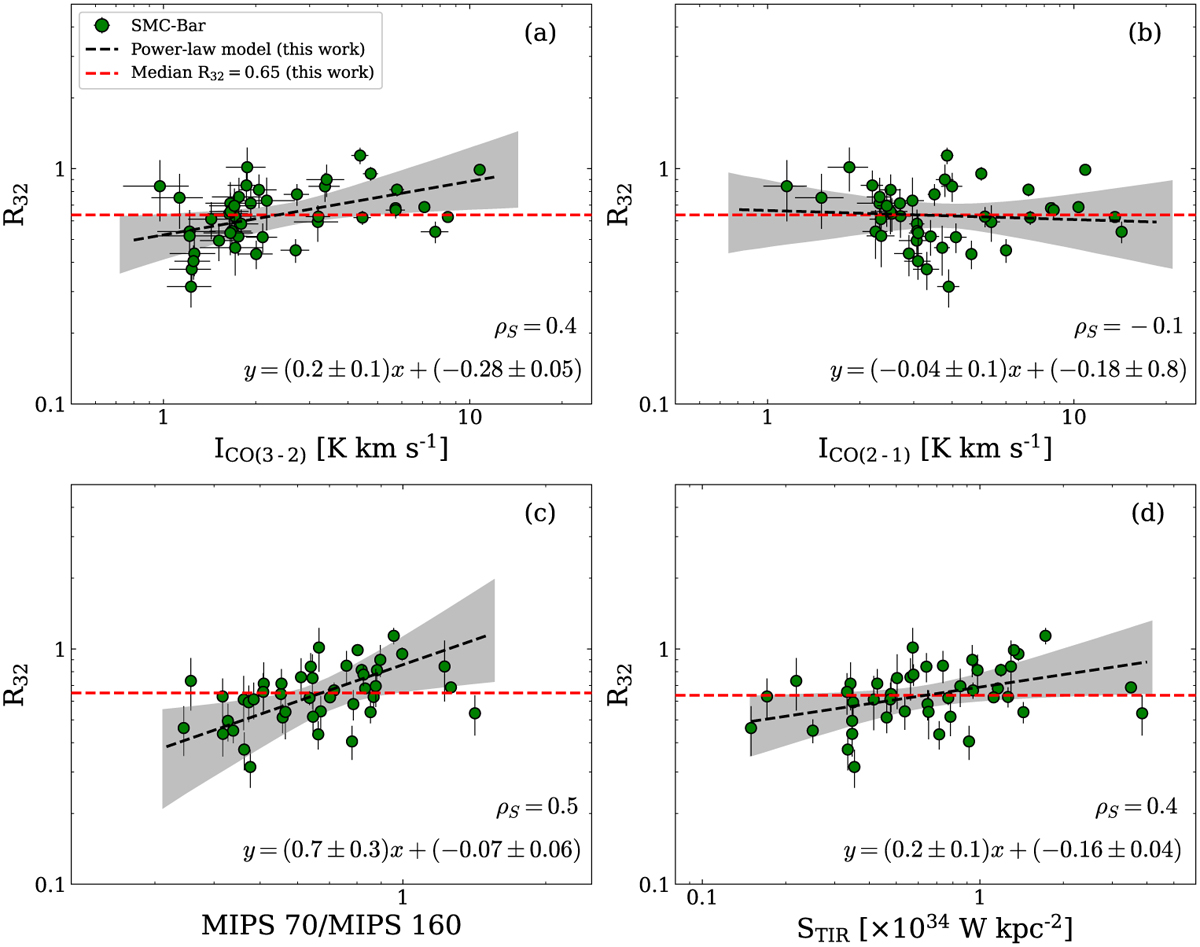
Environment dependence of R32. The ratio (with uncertainty lower than ~25%) is correlated with the local intensity of CO(3–2) and CO(2–1) in panels (a) and (b), respectively. In panel (c), R32 as a function of the far-infrared (FIR)color of the Spitzer MIPS bands (Gordon et al. 2011), and in panel (d), R32 as a function of the TIR surface brightness from Spitzer and Herschel bands (Gordon et al. 2011, 2014). The red and black dashed lines in all panels indicate the median value of R23 and the best fit, respectively. The Spearman’s correlations (ρS) and the best-fit equations (in log–log scale) are located in the right bottom corners.
Current usage metrics show cumulative count of Article Views (full-text article views including HTML views, PDF and ePub downloads, according to the available data) and Abstracts Views on Vision4Press platform.
Data correspond to usage on the plateform after 2015. The current usage metrics is available 48-96 hours after online publication and is updated daily on week days.
Initial download of the metrics may take a while.