Open Access
Fig. 1
Download original image
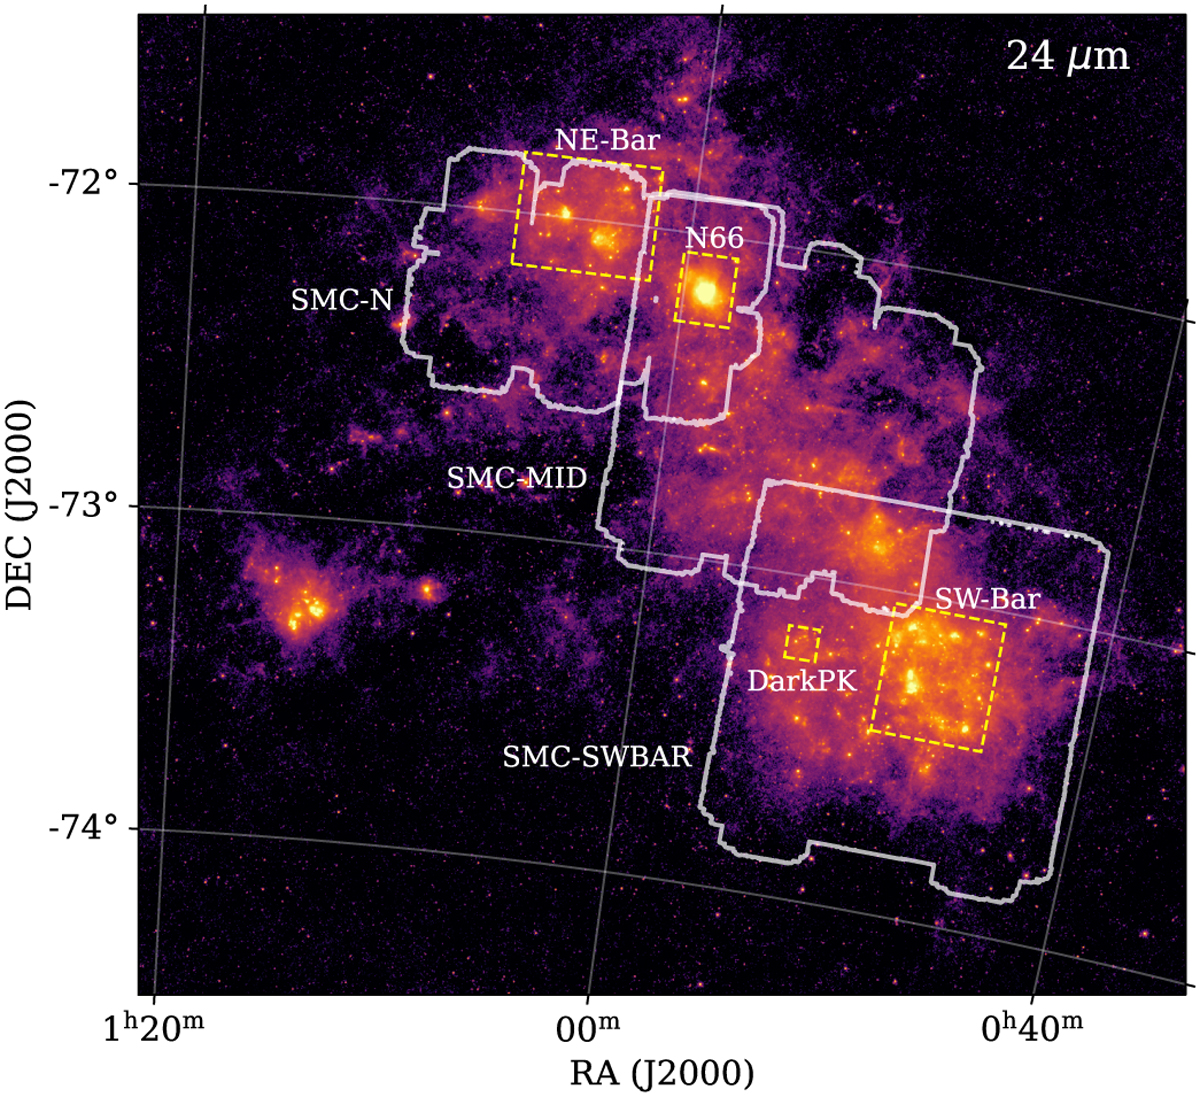
SuperCAM observations of the SMC delineated by white contours. These contours are superimposed on the 24 µm SAGE-SMC image (Gordon et al. 2011). The yellow boxes show the CO(2–1) APEX maps (Saldaño et al. 2023).
Current usage metrics show cumulative count of Article Views (full-text article views including HTML views, PDF and ePub downloads, according to the available data) and Abstracts Views on Vision4Press platform.
Data correspond to usage on the plateform after 2015. The current usage metrics is available 48-96 hours after online publication and is updated daily on week days.
Initial download of the metrics may take a while.