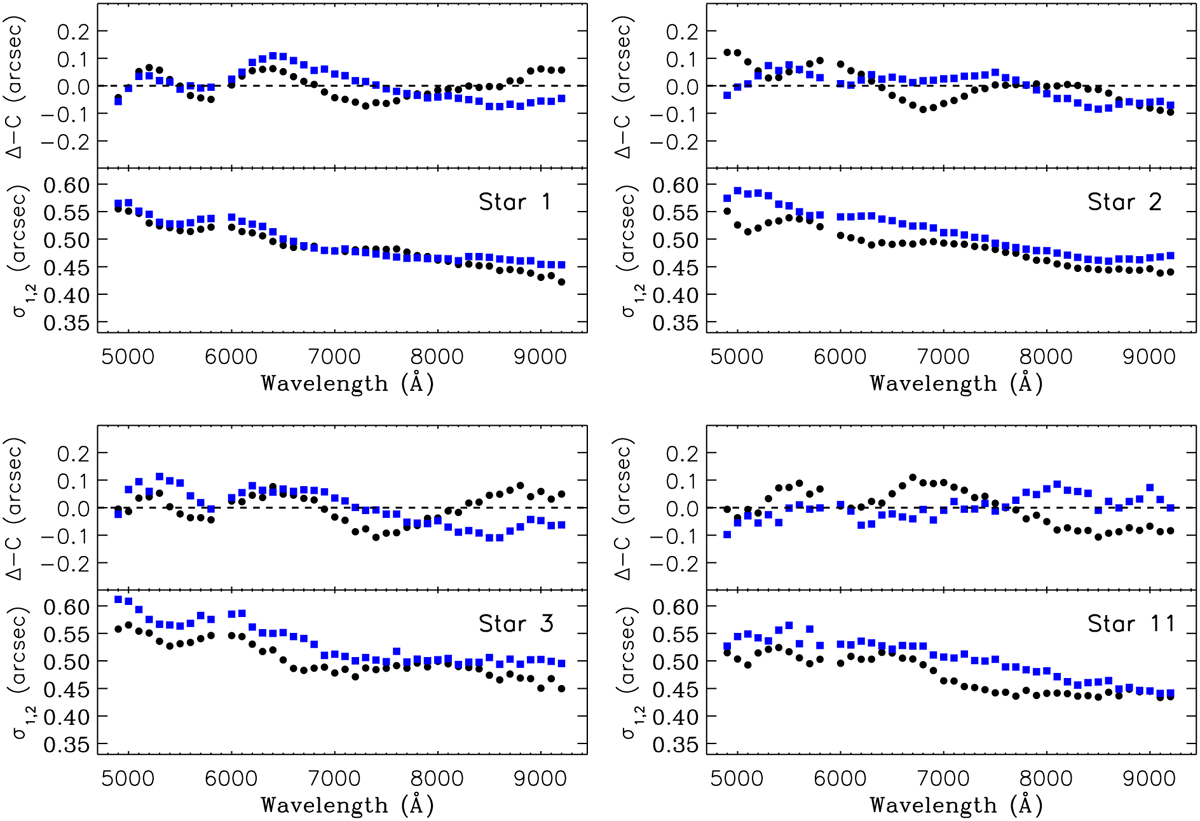
Fig. B.3
Download original image
Characteristic parameters of the Moffat profile model with β = 2.5 fitting the 44 narrowband filter images of selected point-like sources in the MUSE Field of HD90177 labeled HD90177a (see Fig. B.2, top left). The top panels show the wavelength-dependent variations of the centroid (x0,y0) with respect to the average star peak location (indicated by the dashed horizontal line). The bottom panels present the variation in the width parameter σi (i=1,2) with wavelength. Measurements along axis i=1 (horizontal) and i=2 (vertical) are represented by filled black circles and blue squares, respectively. The star numbers correspond to the star labels in Fig. B.2 (top left).
Current usage metrics show cumulative count of Article Views (full-text article views including HTML views, PDF and ePub downloads, according to the available data) and Abstracts Views on Vision4Press platform.
Data correspond to usage on the plateform after 2015. The current usage metrics is available 48-96 hours after online publication and is updated daily on week days.
Initial download of the metrics may take a while.